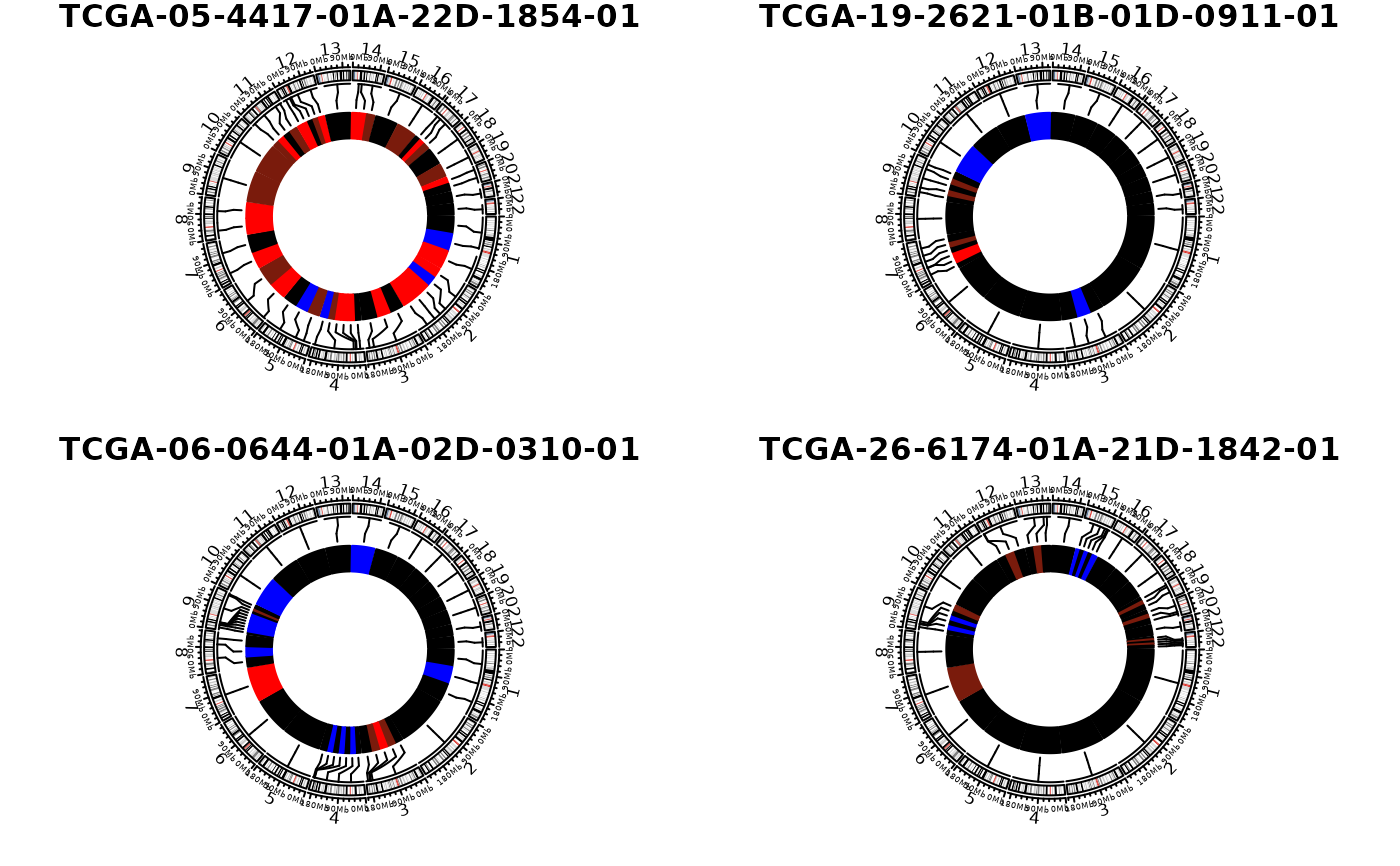
Another visualization method for copy number profile like show_cn_profile.
Arguments
- data
a CopyNumber object or a
data.framecontaining at least 'chromosome', 'start', 'end', 'segVal' these columns.- samples
default is
NULL, can be a chracter vector representing multiple samples or number of samples to show. If data argument is adata.frame, a column called sample must exist.- show_title
if
TRUE(default), show title with sample ID.- chrs
chromosomes start with 'chr'.
- genome_build
genome build version, used when
datais adata.frame, should be 'hg19' or 'hg38'.- col
colors for the heatmaps. If it is
NULL, set tocirclize::colorRamp2(c(1, 2, 4), c("blue", "black", "red")).- side
side of the heatmaps.
- ...
other parameters passing to circlize::circos.genomicHeatmap.
Value
a circos plot
Examples
load(system.file("extdata", "toy_copynumber.RData",
package = "sigminer", mustWork = TRUE
))
# \donttest{
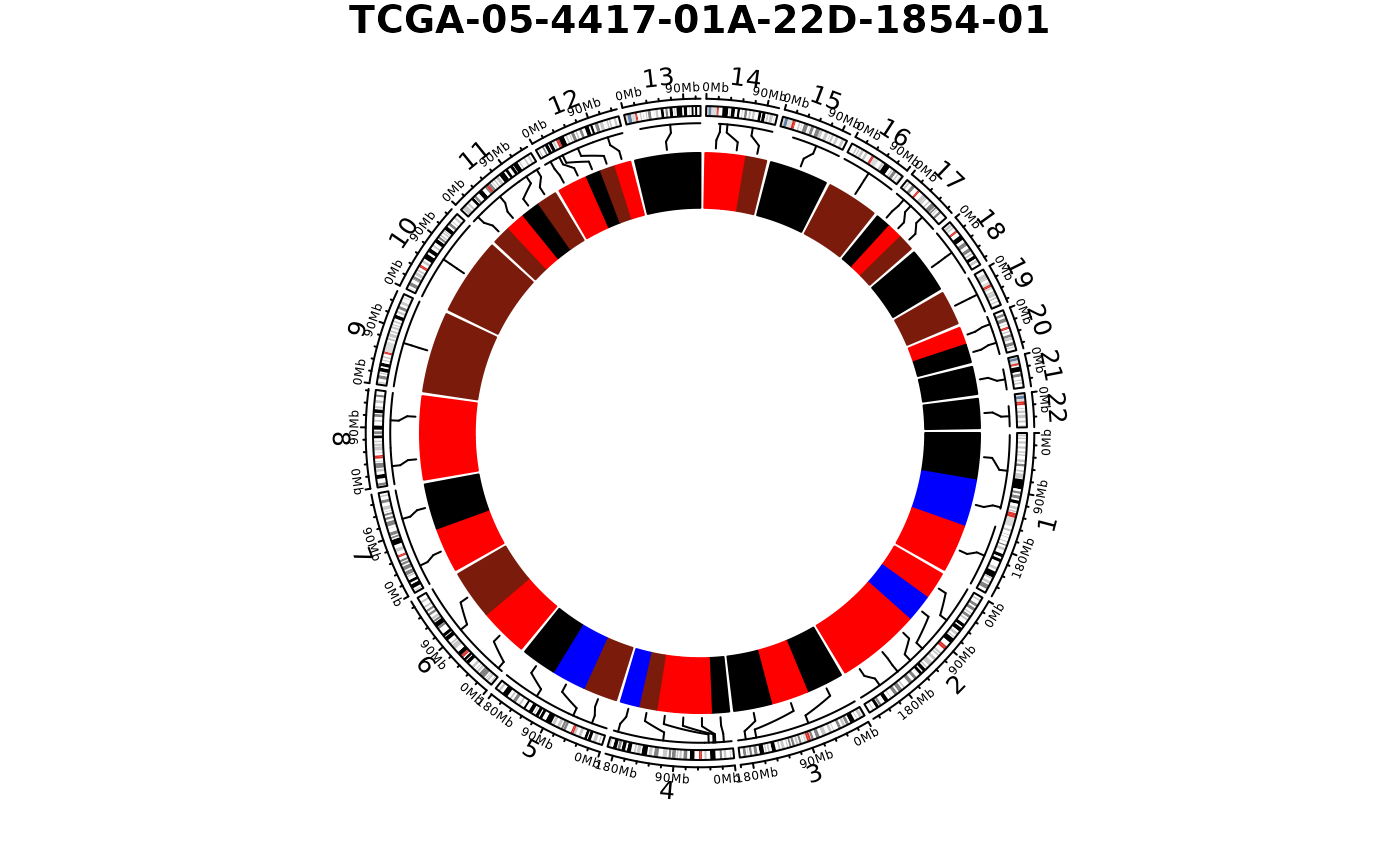
show_cn_circos(cn, samples = 1)
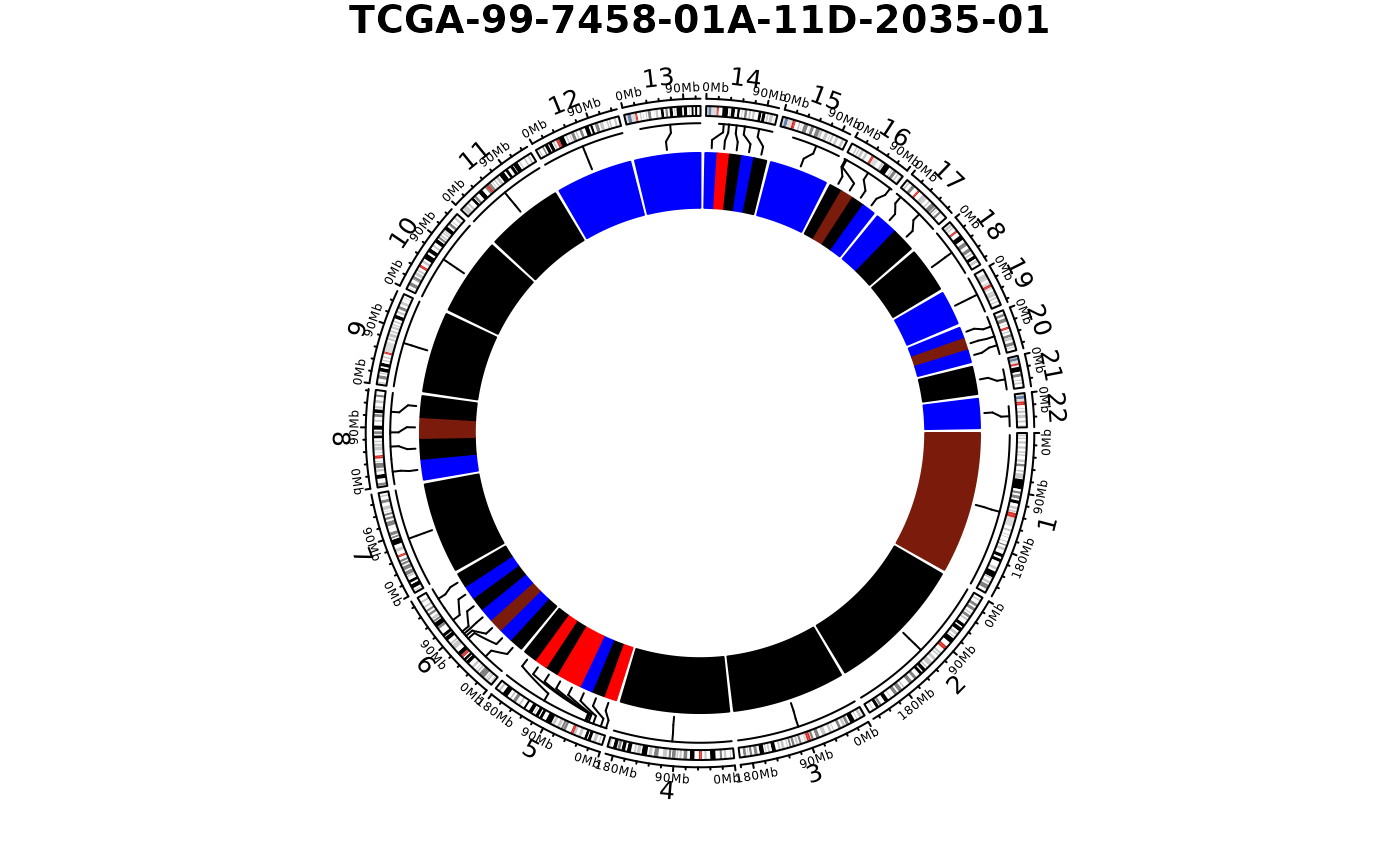
 show_cn_circos(cn, samples = "TCGA-99-7458-01A-11D-2035-01")
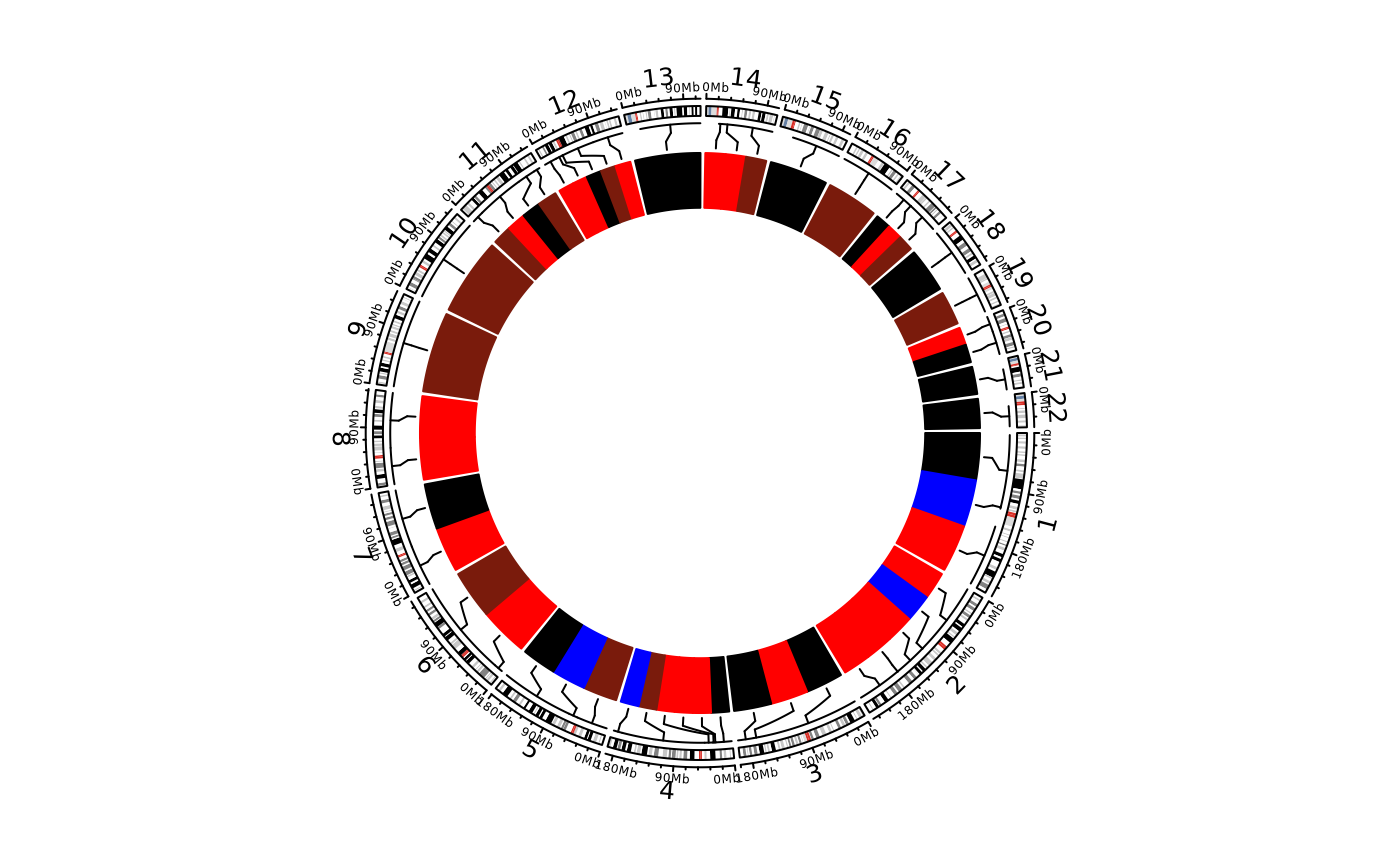
 ## Remove title
show_cn_circos(cn, samples = 1, show_title = FALSE)
## Remove title
show_cn_circos(cn, samples = 1, show_title = FALSE)
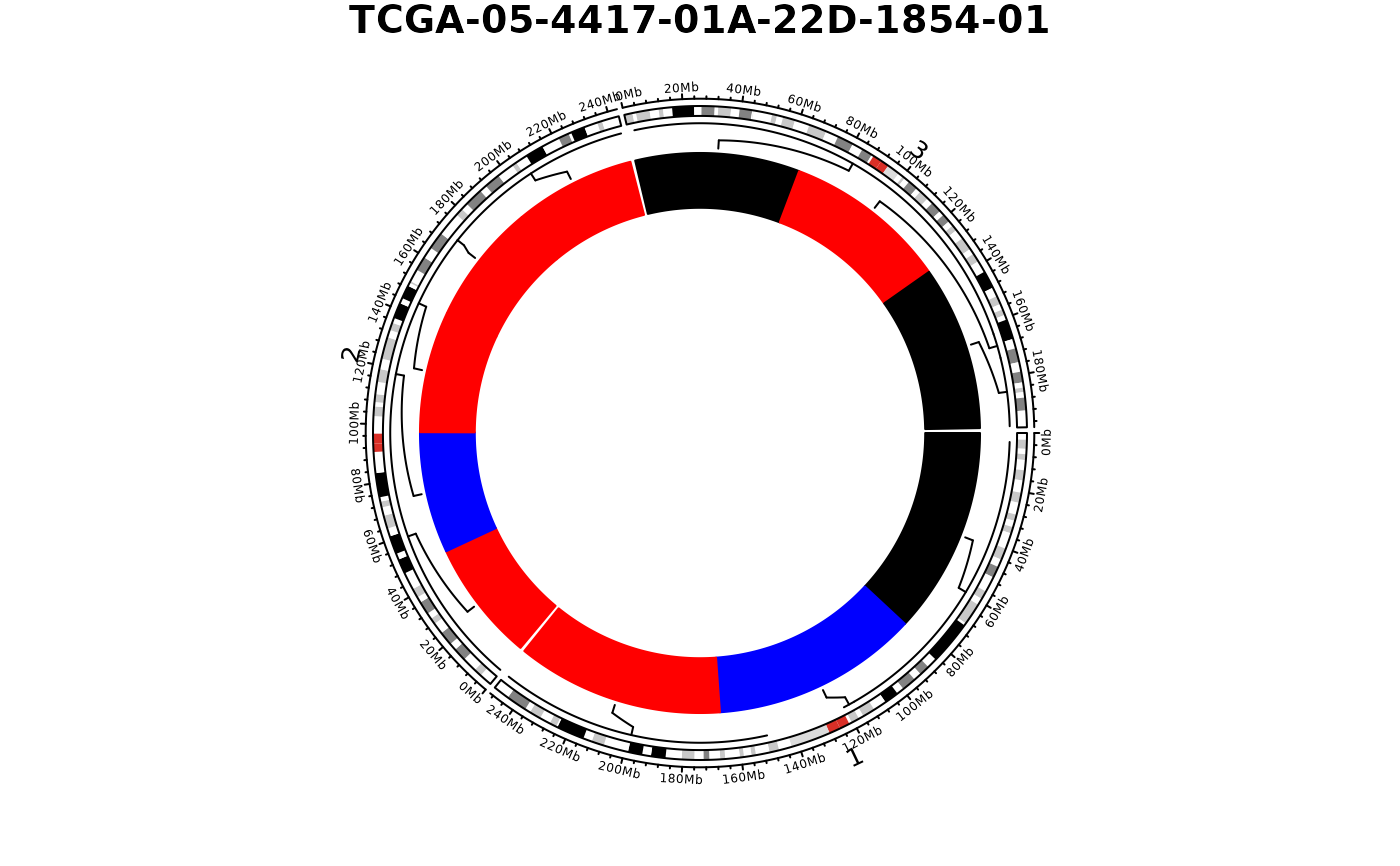
 ## Subset chromosomes
show_cn_circos(cn, samples = 1, chrs = c("chr1", "chr2", "chr3"))
## Subset chromosomes
show_cn_circos(cn, samples = 1, chrs = c("chr1", "chr2", "chr3"))
 ## Arrange plots
layout(matrix(1:4, 2, 2))
show_cn_circos(cn, samples = 4)
## Arrange plots
layout(matrix(1:4, 2, 2))
show_cn_circos(cn, samples = 4)
 layout(1) # reset layout
# }
layout(1) # reset layout
# }