Show Copy Number Distribution either by Length or Chromosome
Source:R/show_cn_distribution.R
show_cn_distribution.RdVisually summarize copy number distribution either by copy number segment length
or chromosome. Input is a CopyNumber object, genome_build option will
read from genome_build slot of object.
show_cn_distribution(
  data,
  rm_normal = TRUE,
  mode = c("ld", "cd"),
  fill = FALSE,
  scale_chr = TRUE,
  base_size = 14
)
Arguments
- data
a CopyNumber object.
- rm_normal
logical. Whether remove normal copy (i.e. "segVal" equals 2), default is
TRUE.- mode
either "ld" for distribution by CN length or "cd" for distribution by chromosome.
- fill
when
modeis "cd" andfillisTRUE, plot percentage instead of count.- scale_chr
logical. If
TRUE, normalize count to per Megabase unit.- base_size
overall font size.
Value
a ggplot object
Examples
# Load copy number object
load(system.file("extdata", "toy_copynumber.RData",
package = "sigminer", mustWork = TRUE
))
# Plot distribution
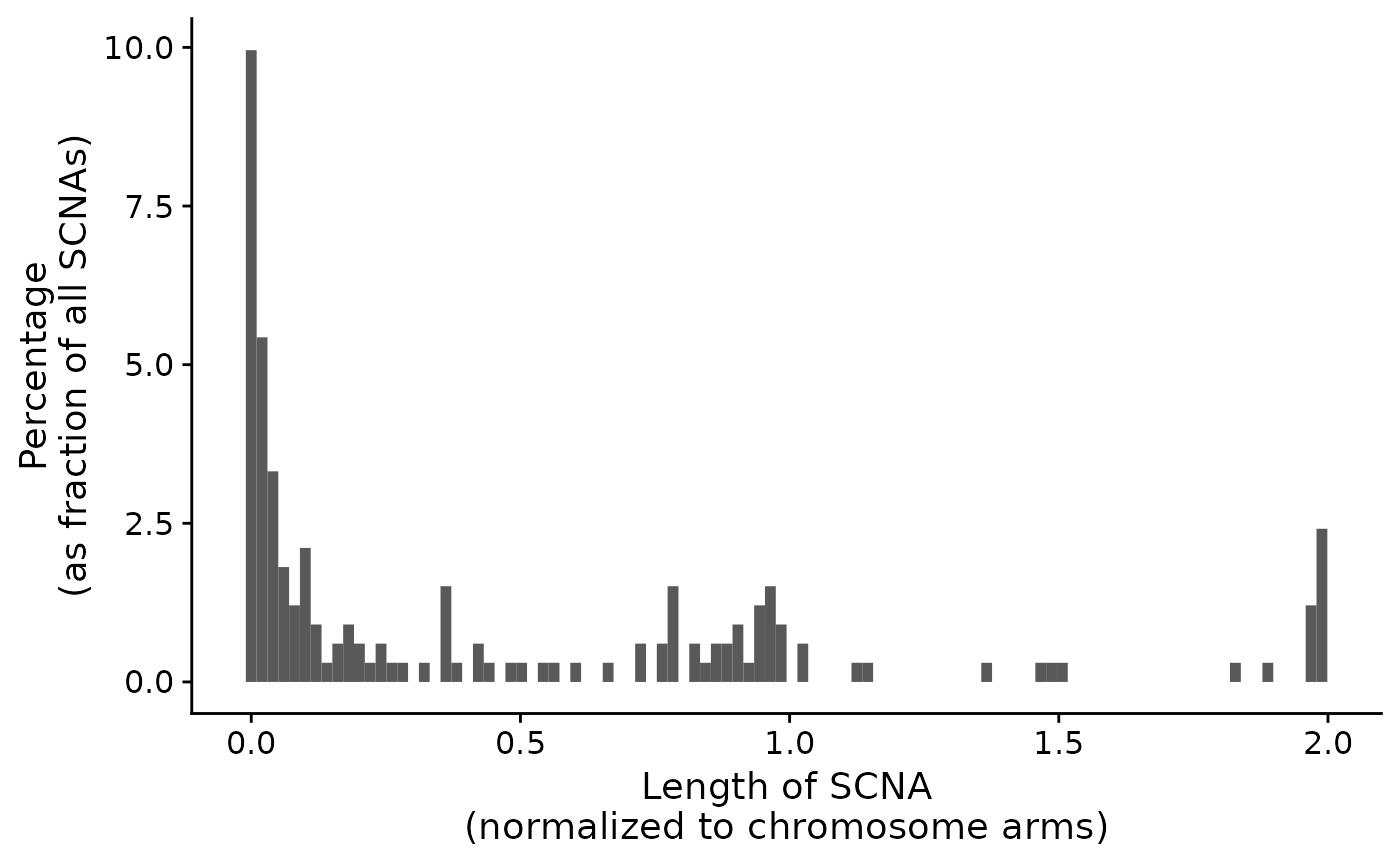
p1 <- show_cn_distribution(cn)
p1
#> Warning: The dot-dot notation (`..density..`) was deprecated in ggplot2 3.4.0.
#> ℹ Please use `after_stat(density)` instead.
#> ℹ The deprecated feature was likely used in the sigminer package.
#> Please report the issue at <https://github.com/ShixiangWang/sigminer/issues>.
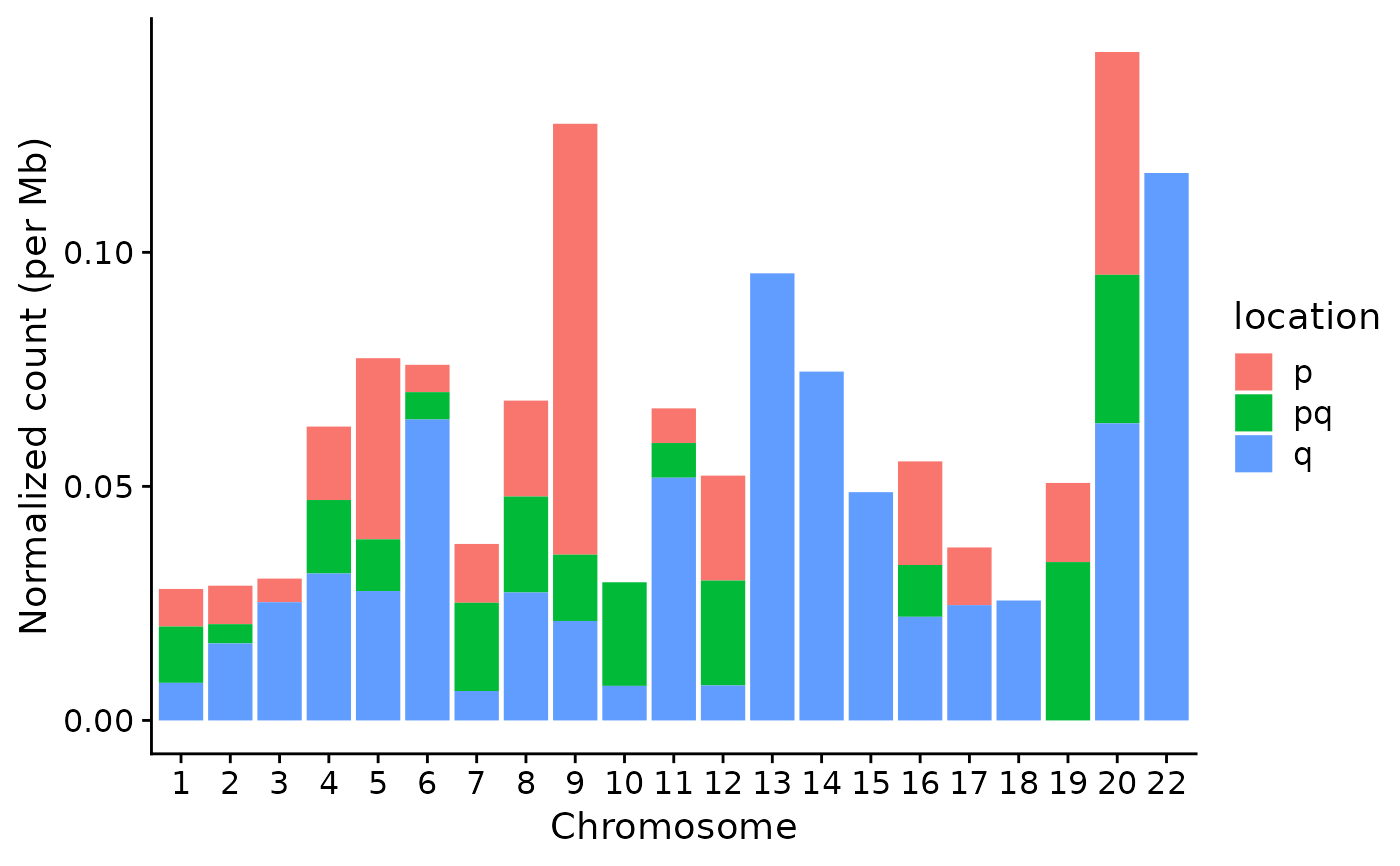
 p2 <- show_cn_distribution(cn, mode = "cd")
p2
p2 <- show_cn_distribution(cn, mode = "cd")
p2
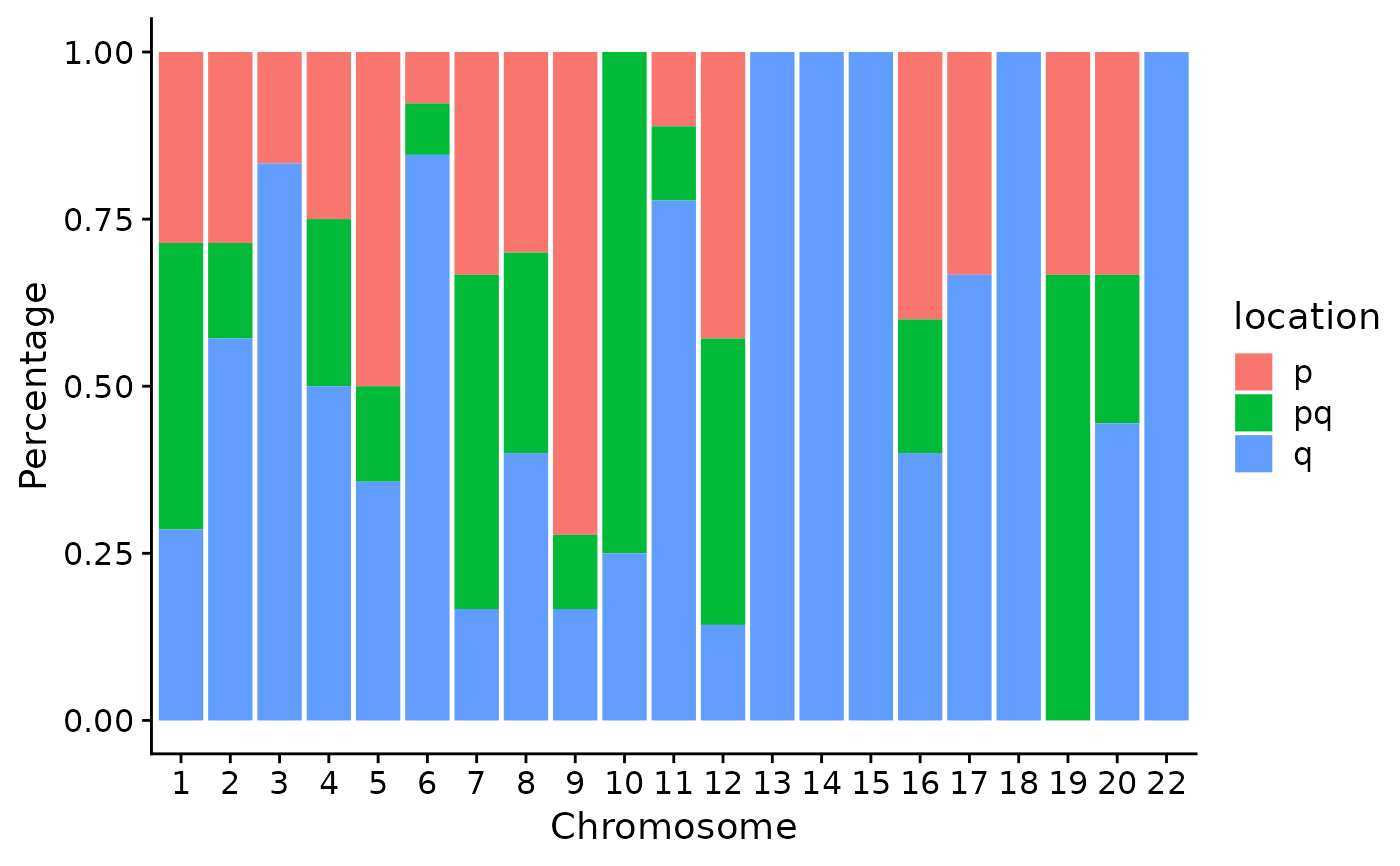
 p3 <- show_cn_distribution(cn, mode = "cd", fill = TRUE)
p3
p3 <- show_cn_distribution(cn, mode = "cd", fill = TRUE)
p3