Using result data from get_group_comparison, this function plots
genotypes/phenotypes comparison between signature groups using ggplot2 package and return
a list of ggplot object contains individual and combined plots. The combined
plot is easily saved to local using cowplot::save_plot(). Of note, default fisher
test p values are shown for categorical data and fdr values are shown for
continuous data.
show_group_comparison(
  group_comparison,
  xlab = "group",
  ylab_co = NA,
  legend_title_ca = NA,
  legend_position_ca = "bottom",
  set_ca_sig_yaxis = FALSE,
  set_ca_custom_xlab = FALSE,
  show_pvalue = TRUE,
  ca_p_threshold = 0.01,
  method = "wilcox.test",
  p.adjust.method = "fdr",
  base_size = 12,
  font_size_x = 12,
  text_angle_x = 30,
  text_hjust_x = 0.2,
  ...
)
Arguments
- group_comparison
a
listfrom result of get_group_comparison function.- xlab
lab name of x axis for all plots. if it is
NA, remove title for x axis.- ylab_co
lab name of y axis for plots of continuous type data. Of note, this argument should be a character vector has same length as
group_comparison, the location for categorical type data should mark withNA.- legend_title_ca
legend title for plots of categorical type data.
- legend_position_ca
legend position for plots of categorical type data. Of note, this argument should be a character vector has same length as
group_comparison, the location for continuous type data should mark withNA.- set_ca_sig_yaxis
if
TRUE, use y axis to show signature proportion instead of variable proportion.- set_ca_custom_xlab
only works when
set_ca_sig_yaxisisTRUE. IfTRUE, set x labels using inputxlab, otherwise variable names will be used.- show_pvalue
if
TRUE, show p values.- ca_p_threshold
a p threshold for categorical variables, default is 0.01. A p value less than 0.01 will be shown as
P < 0.01.- method
a character string indicating which method to be used for comparing means. It can be 't.test', 'wilcox.test' etc..
- p.adjust.method
correction method, default is 'fdr'. Run
p.adjust.methodsto see all available options.- base_size
overall font size.
- font_size_x
font size for x.
- text_angle_x
text angle for x.
- text_hjust_x
adjust x axis text
- ...
other paramters pass to
ggpubr::compare_means()orggpubr::stat_compare_means()according to the specifiedmethod.
Value
a list of ggplot objects.
Examples
# \donttest{
load(system.file("extdata", "toy_copynumber_signature_by_W.RData",
package = "sigminer", mustWork = TRUE
))
# Assign samples to clusters
groups <- get_groups(sig, method = "k-means")
#> ℹ [2025-12-25 15:39:18.816173]: Started.
#> ✔ [2025-12-25 15:39:18.817989]: 'Signature' object detected.
#> ℹ [2025-12-25 15:39:18.822914]: Running k-means with 2 clusters...
#> ℹ [2025-12-25 15:39:18.825493]: Generating a table of group and signature contribution (stored in 'map_table' attr):
#> Sig1 Sig2
#> 1 0.2097559 0.7901116
#> 2 0.8964984 0.1035016
#> ℹ [2025-12-25 15:39:18.827183]: Assigning a group to a signature with the maximum fraction...
#> ℹ [2025-12-25 15:39:18.831512]: Summarizing...
#> group #1: 2 samples with Sig2 enriched.
#> group #2: 8 samples with Sig1 enriched.
#> ! [2025-12-25 15:39:18.833866]: The 'enrich_sig' column is set to dominant signature in one group, please check and make it consistent with biological meaning (correct it by hand if necessary).
#> ℹ [2025-12-25 15:39:18.835444]: 0.019 secs elapsed.
set.seed(1234)
groups$prob <- rnorm(10)
groups$new_group <- sample(c("1", "2", "3", "4", NA), size = nrow(groups), replace = TRUE)
# Compare groups (filter NAs for categorical coloumns)
groups.cmp <- get_group_comparison(groups[, -1],
col_group = "group",
cols_to_compare = c("prob", "new_group"),
type = c("co", "ca"), verbose = TRUE
)
#> Treat prob as continuous variable.
#> Treat new_group as categorical variable.
# Compare groups (Set NAs of categorical columns to 'Rest')
groups.cmp2 <- get_group_comparison(groups[, -1],
col_group = "group",
cols_to_compare = c("prob", "new_group"),
type = c("co", "ca"), NAs = "Rest", verbose = TRUE
)
#> Treat prob as continuous variable.
#> Treat new_group as categorical variable.
show_group_comparison(groups.cmp)
#> $ca
#> $ca$new_group
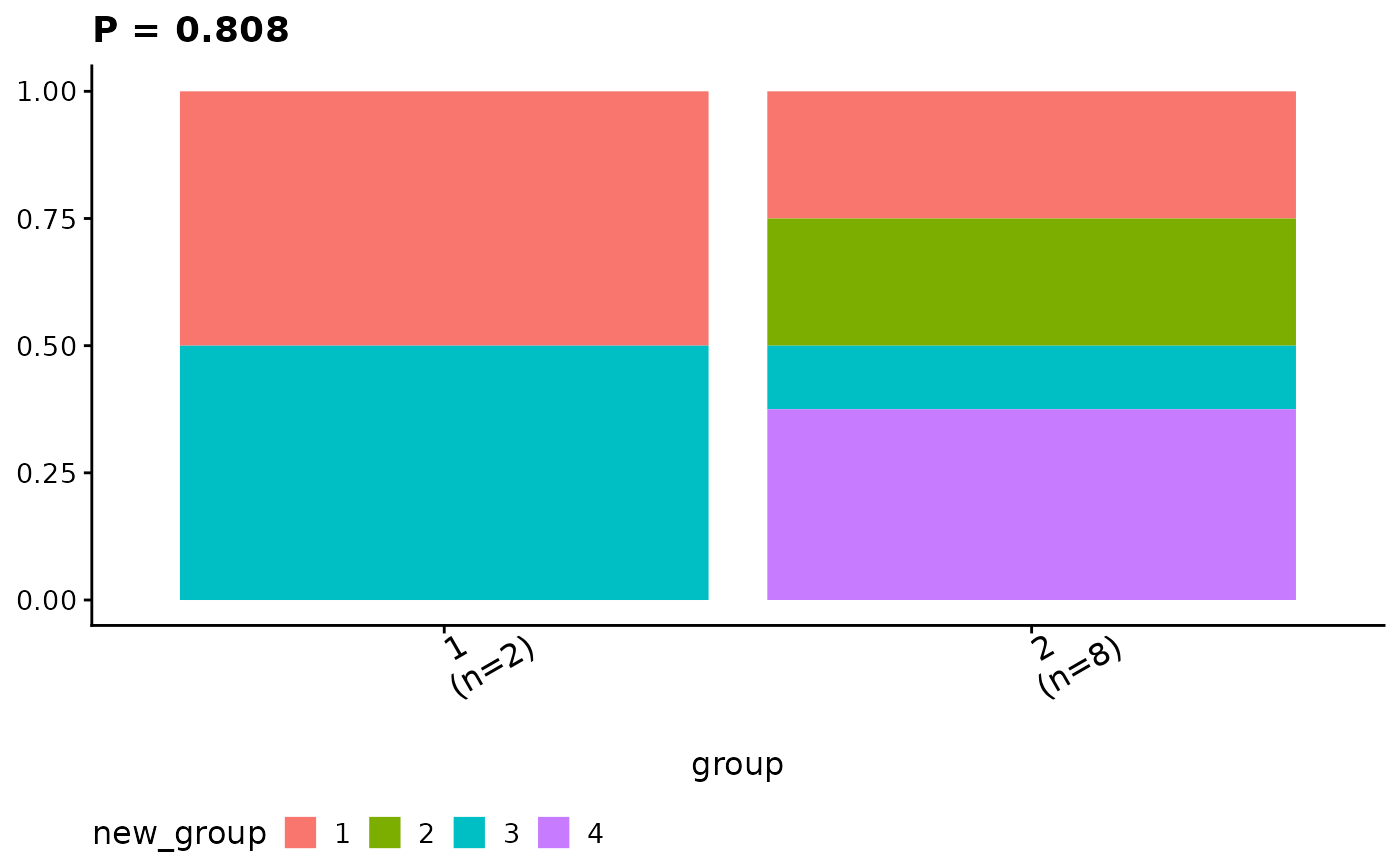 #>
#>
#> $ca_comb
#>
#>
#> $ca_comb
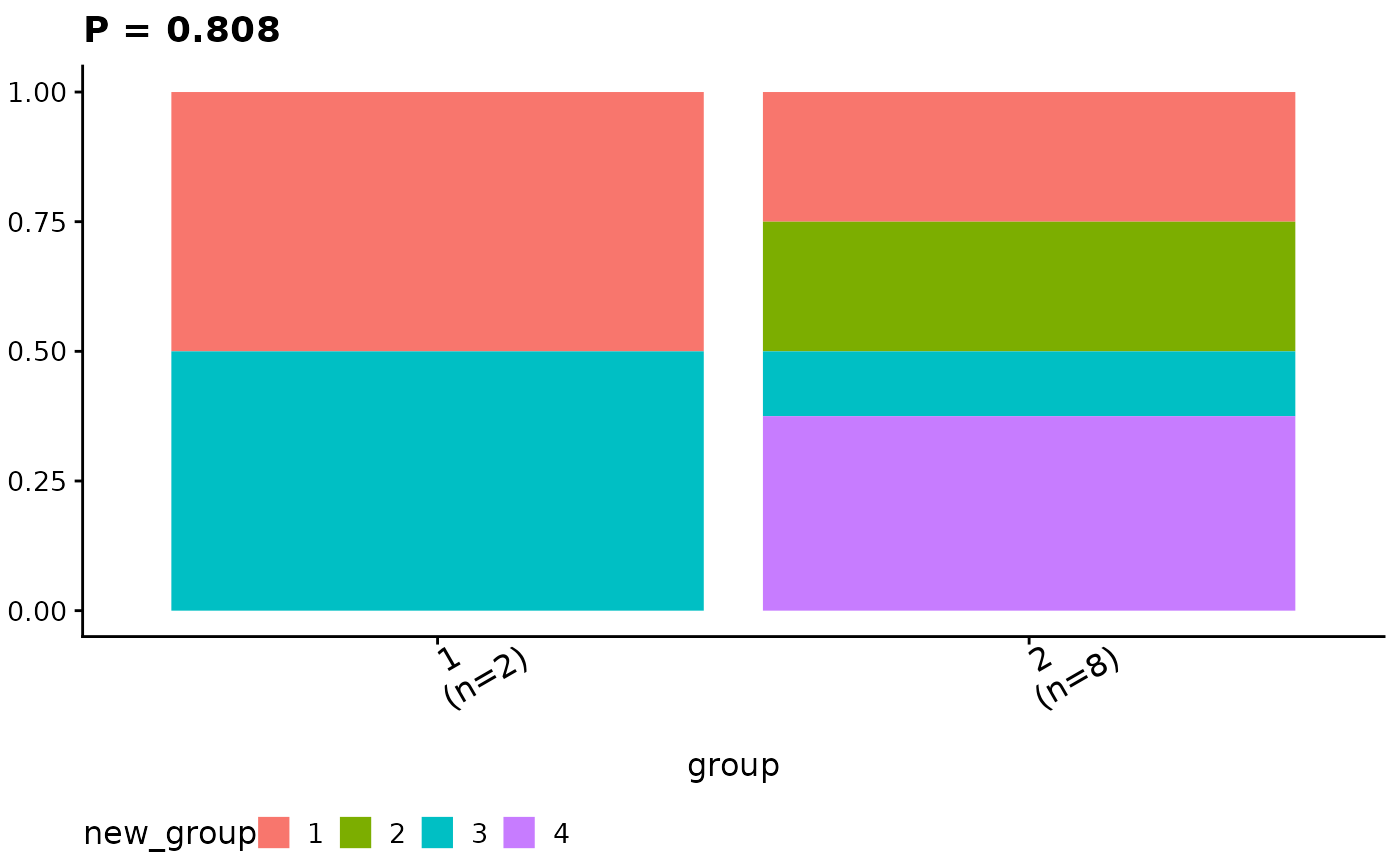 #>
#> $co
#> $co$prob
#>
#> $co
#> $co$prob
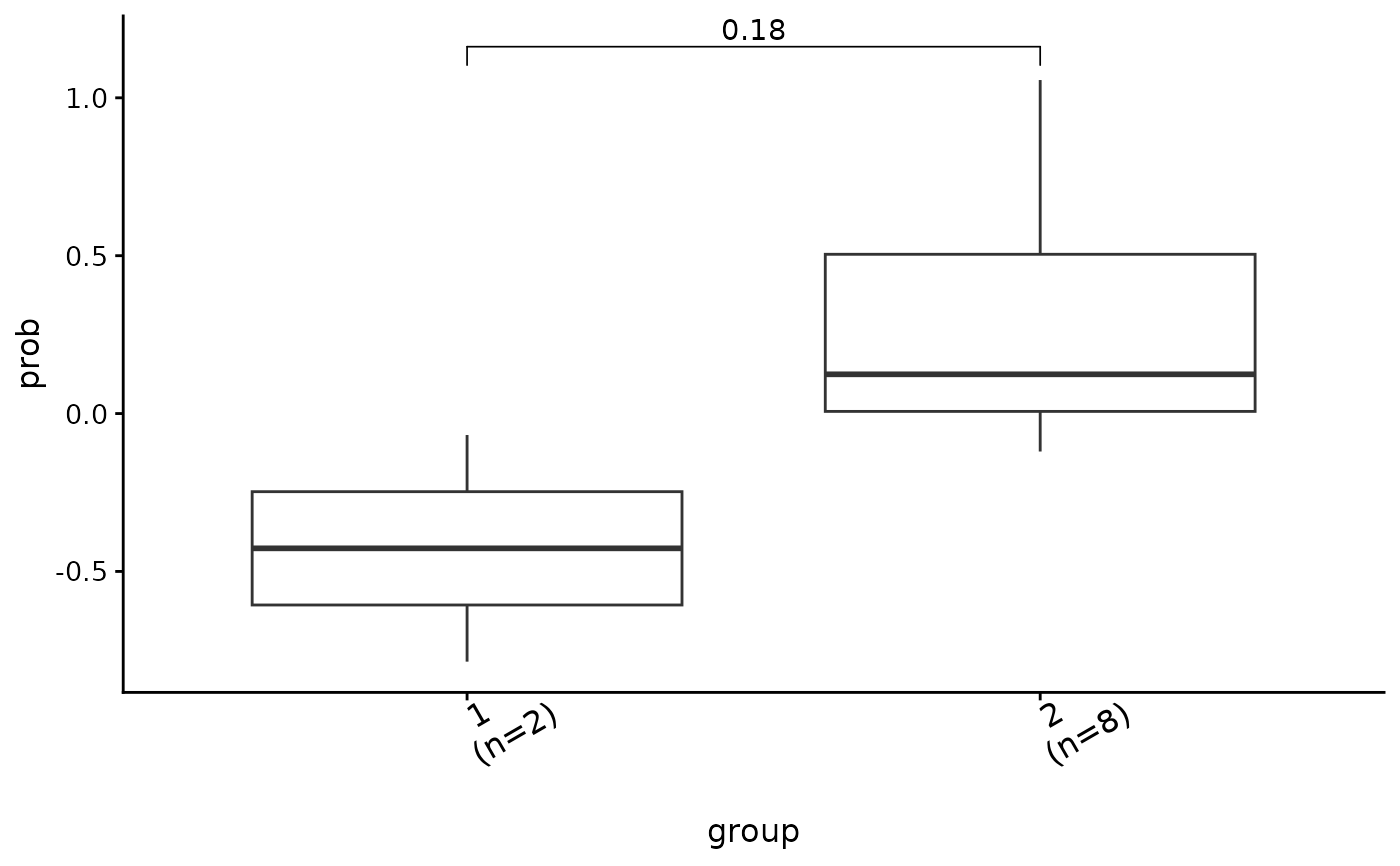 #>
#>
#> $co_comb
#>
#>
#> $co_comb
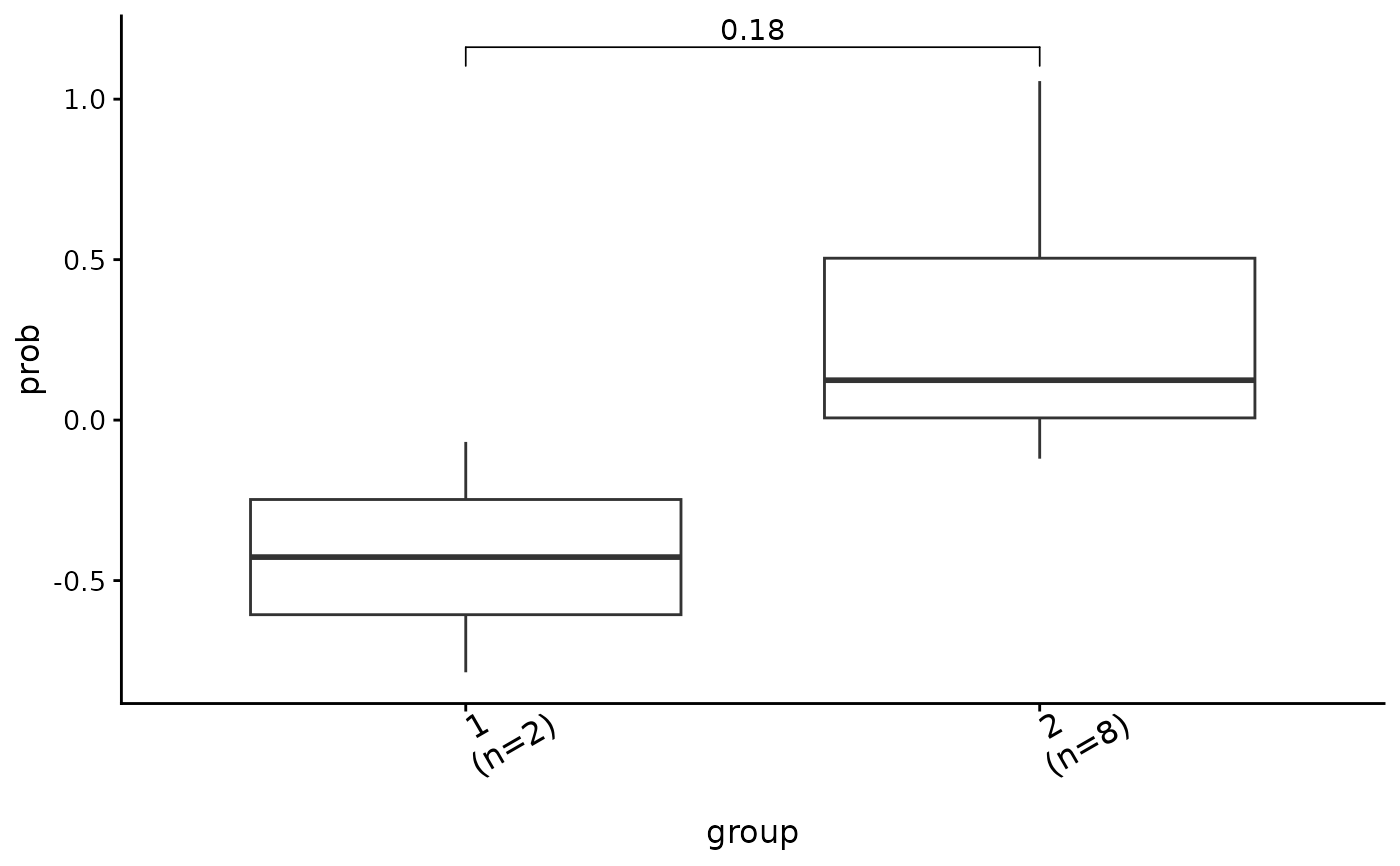 #>
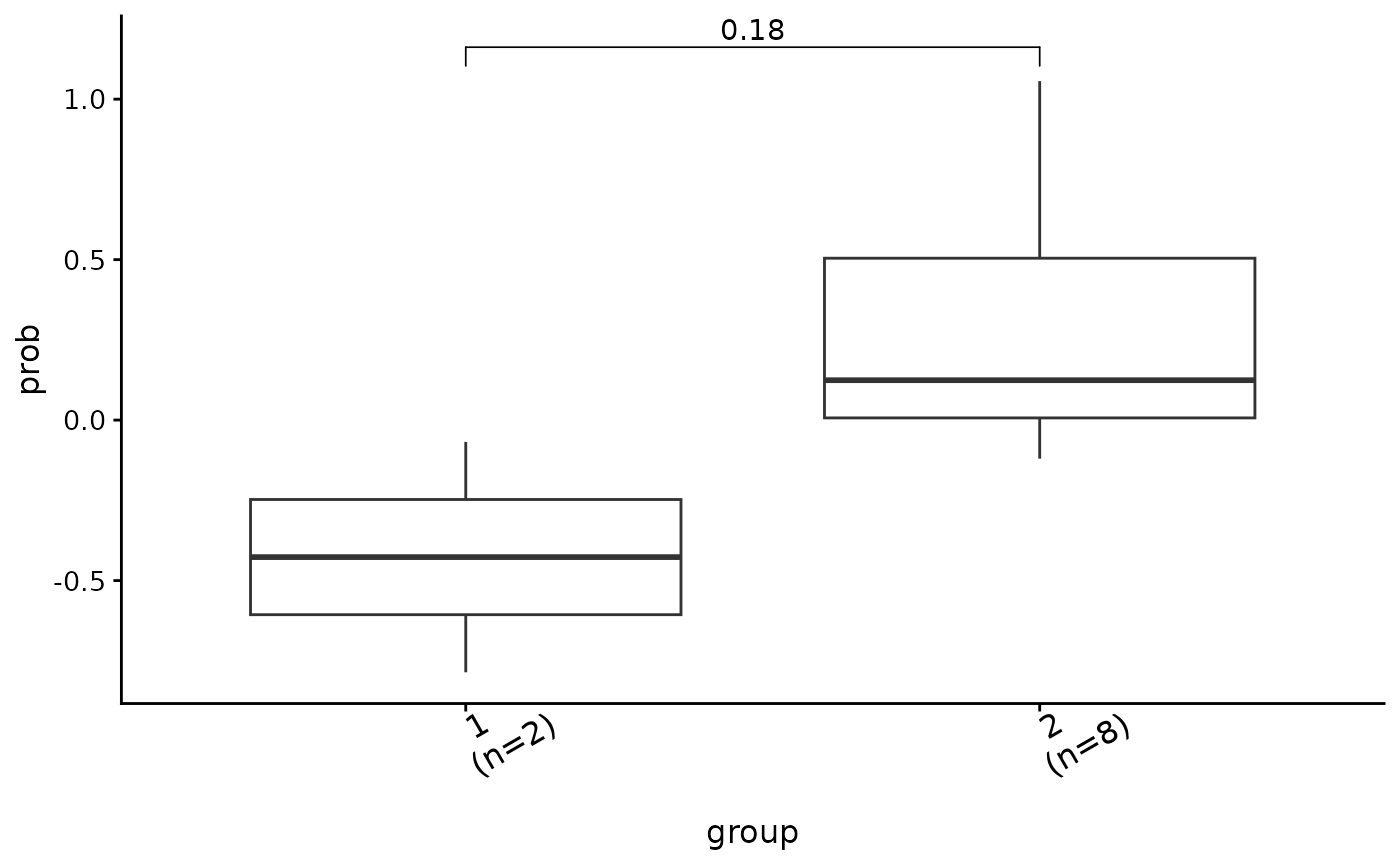
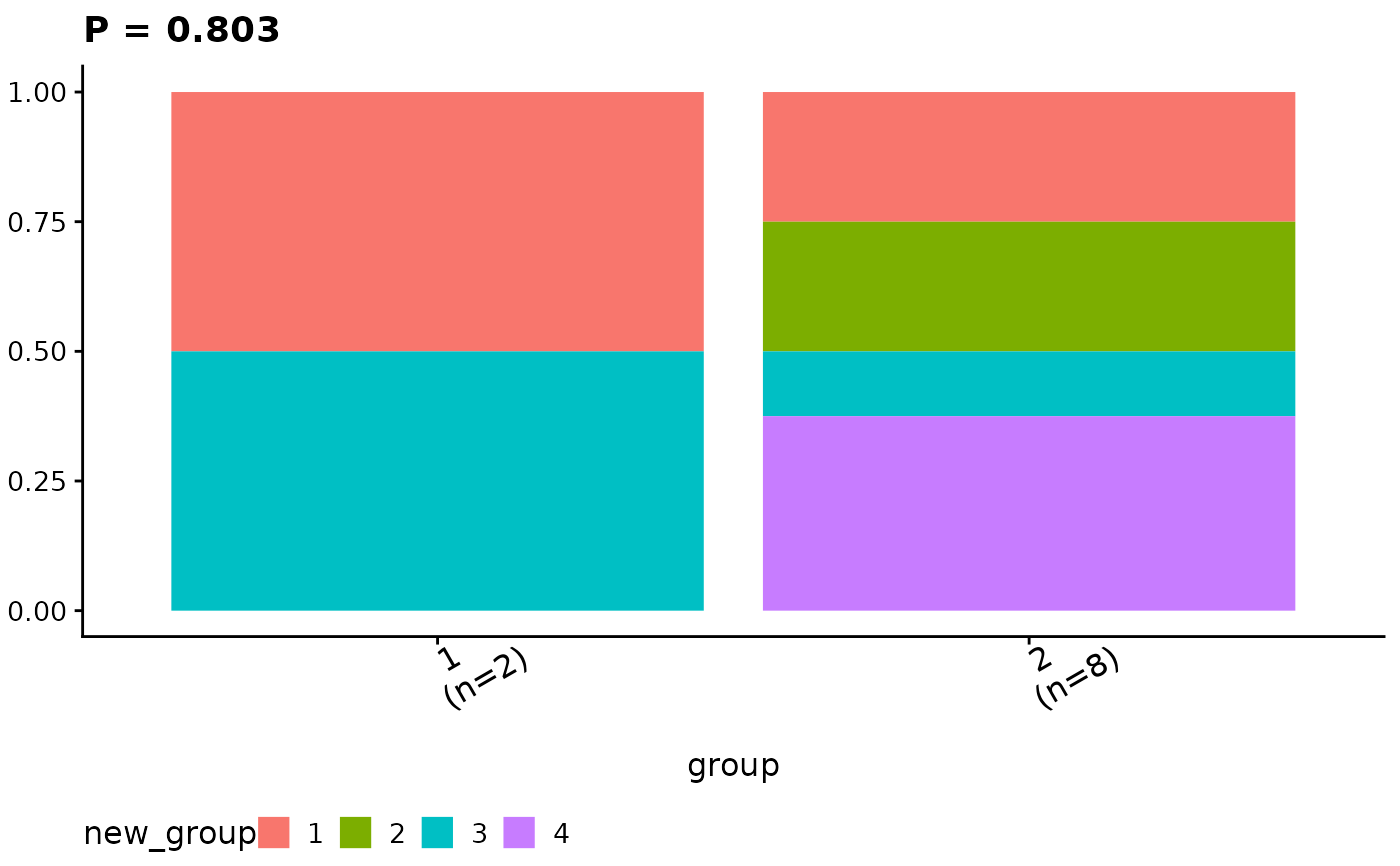
ggcomp <- show_group_comparison(groups.cmp2)
ggcomp$co_comb
 ggcomp$ca_comb
 # }
# }