This is a general function, it can be used in any proper analysis.
Arguments
- data
a
data.frame.- gvar
a group variable name/index.
- dvar
a distribution variable name/index.
- fun
a function to summarize, default is stats::median, can also be mean.
- order_by_fun
if
TRUE, reorder the groups by summary measure computed by argumentfun.- alpha
alpha for points, range from 0 to 1.
- g_label
a string 'label' (default) for labeling with sample size, or 'norm' to show just group name, or a named vector to set facet labels.
- g_angle
angle for facet labels, default is
0.- g_position
position for facet labels, default is 'top', can also be 'bottom'.
- point_size
size of point.
- segment_size
size of segment.
- segment_color
color of segment.
- xlab
title for x axis.
- ylab
title for y axis.
- nrow
number of row.
- background_color
background color for plot panel.
Value
a ggplot object.
Examples
# \donttest{
set.seed(1234)
data <- data.frame(
yval = rnorm(120),
gr = c(rep("A", 50), rep("B", 40), rep("C", 30))
)
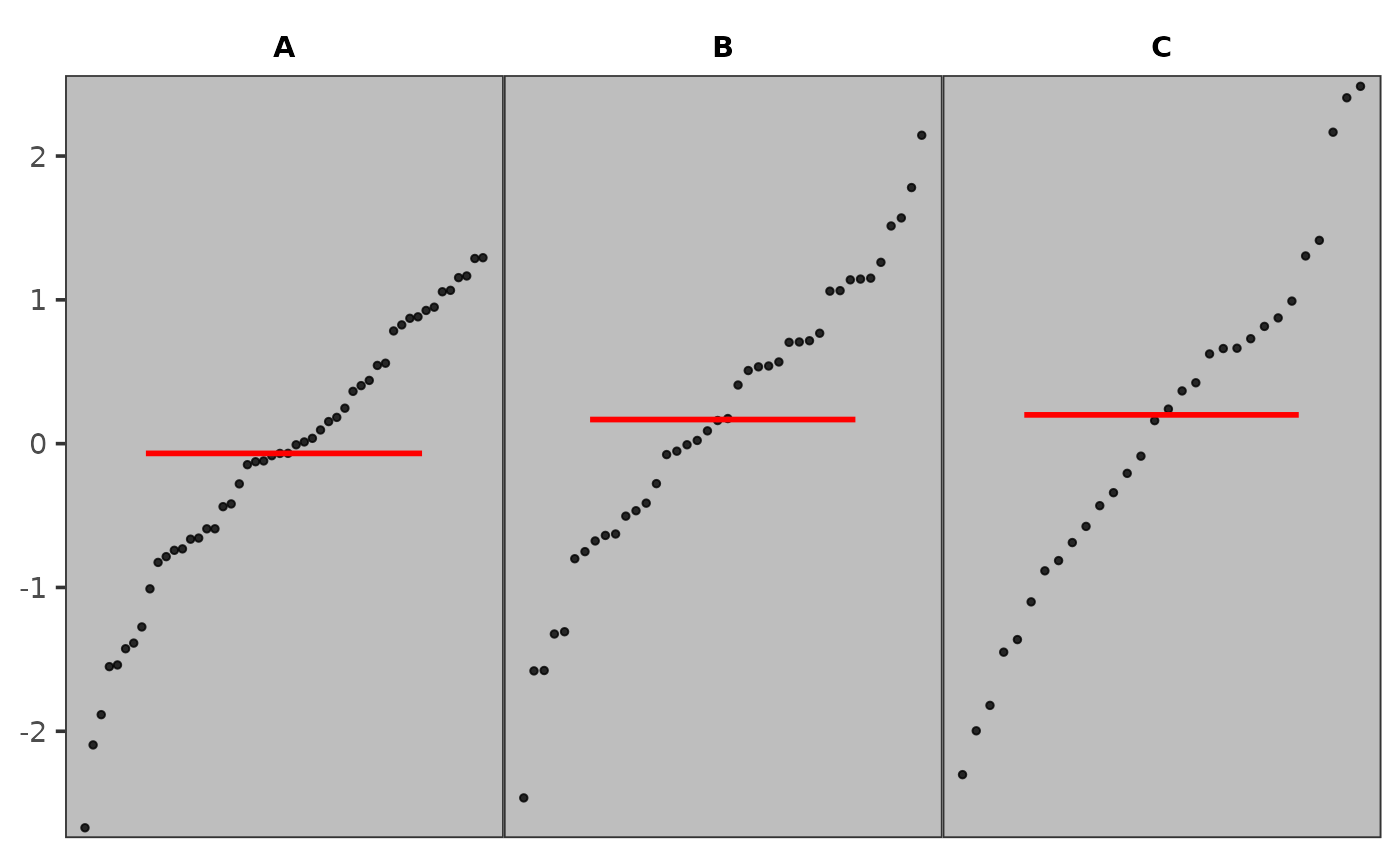
p <- show_group_distribution(data,
gvar = 2, dvar = 1,
g_label = "norm",
background_color = "grey"
)
p
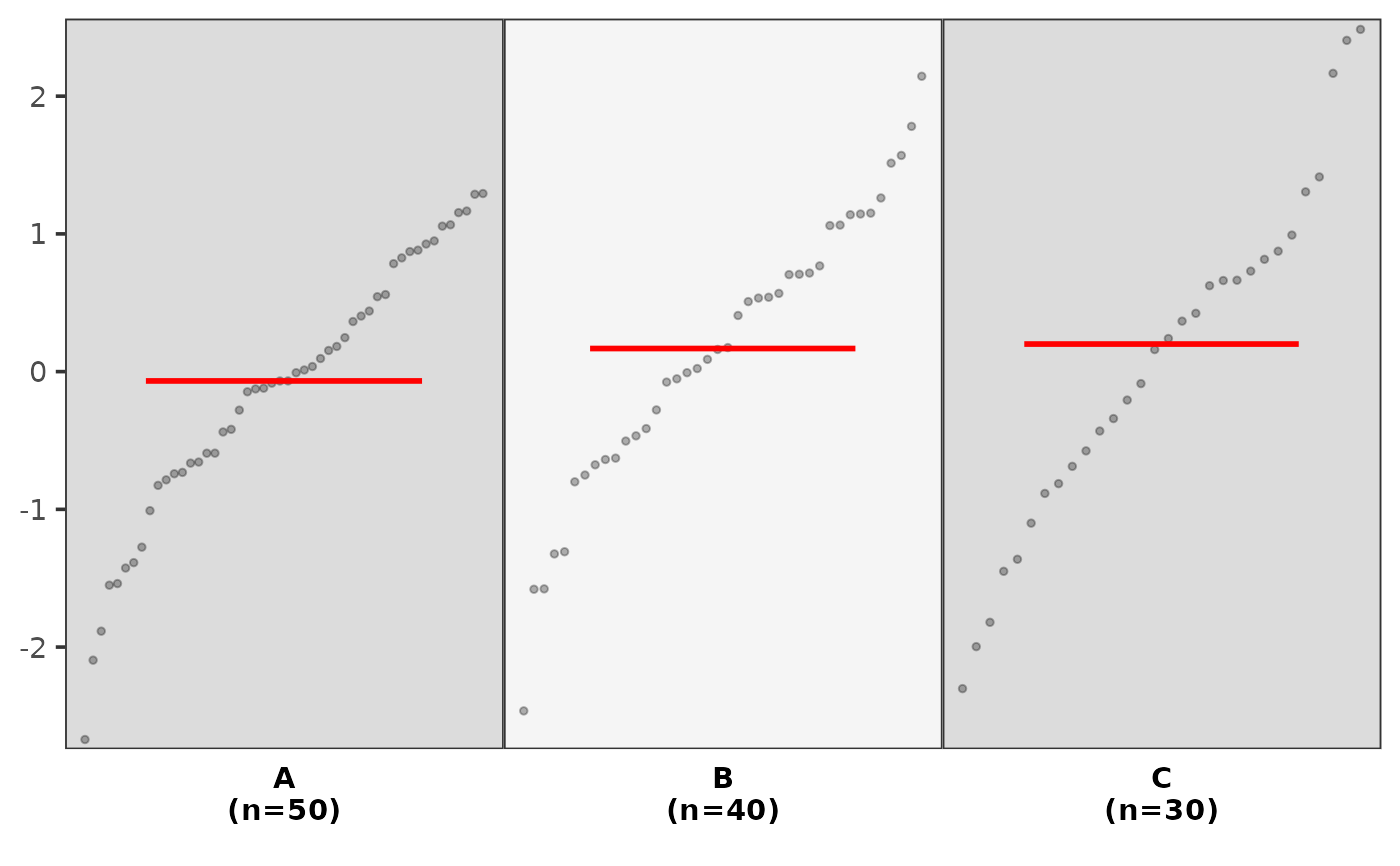
 p2 <- show_group_distribution(data,
gvar = "gr", dvar = "yval",
g_position = "bottom",
order_by_fun = TRUE,
alpha = 0.3
)
p2
p2 <- show_group_distribution(data,
gvar = "gr", dvar = "yval",
g_position = "bottom",
order_by_fun = TRUE,
alpha = 0.3
)
p2
 # Set custom group names
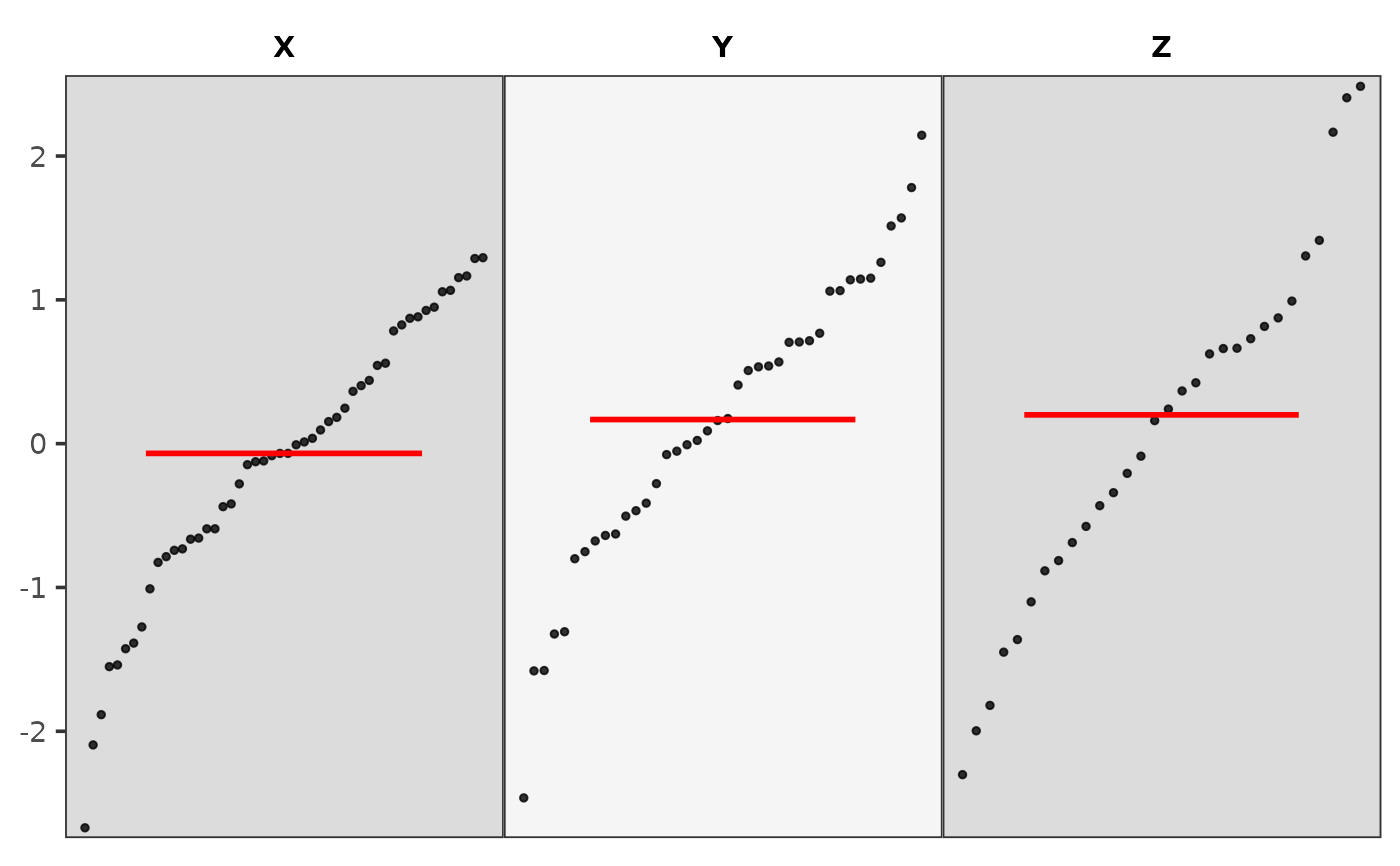
p3 <- show_group_distribution(data,
gvar = 2, dvar = 1,
g_label = c("A" = "X", "B" = "Y", "C" = "Z")
)
p3
# Set custom group names
p3 <- show_group_distribution(data,
gvar = 2, dvar = 1,
g_label = c("A" = "X", "B" = "Y", "C" = "Z")
)
p3
 # }
# }