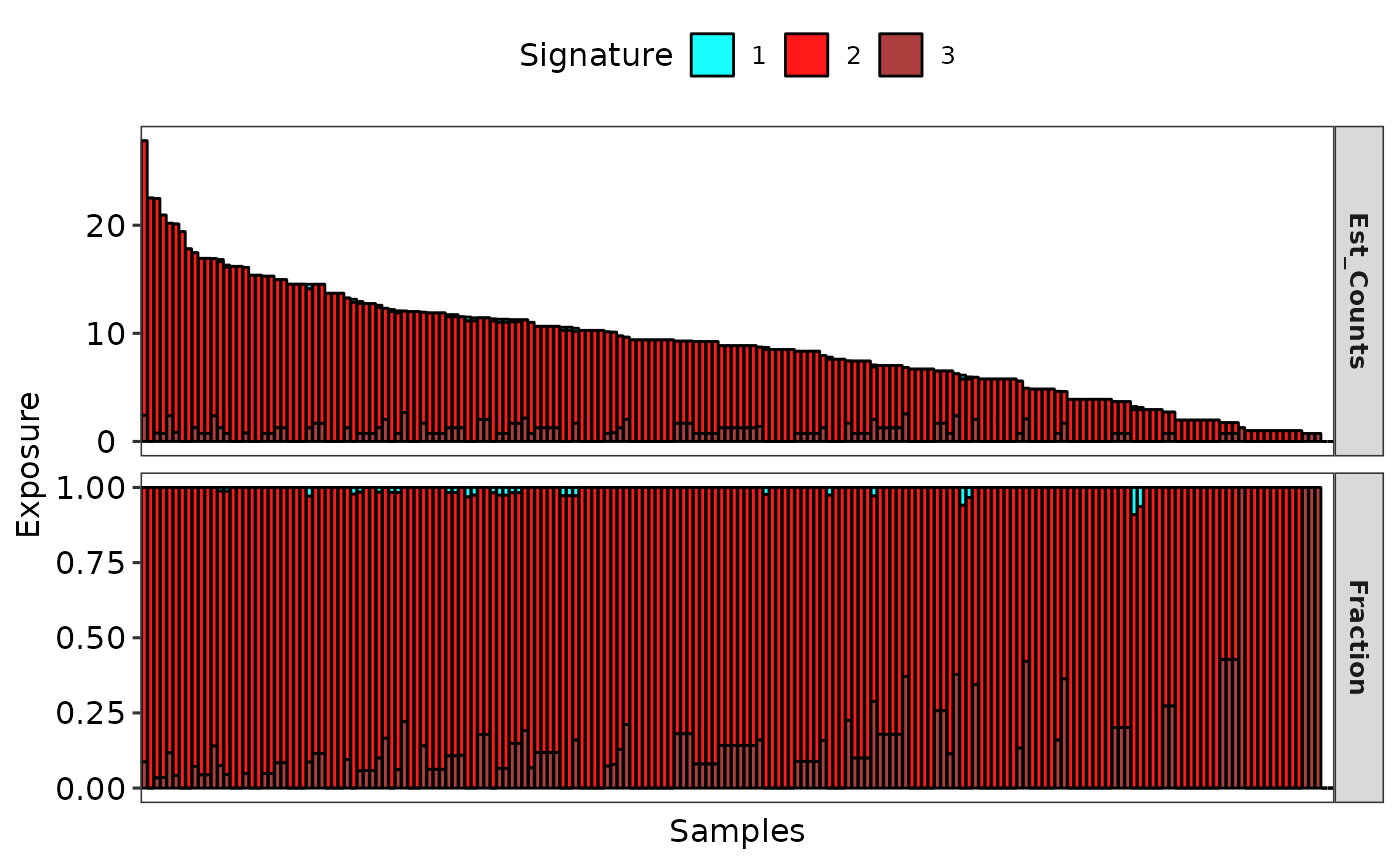
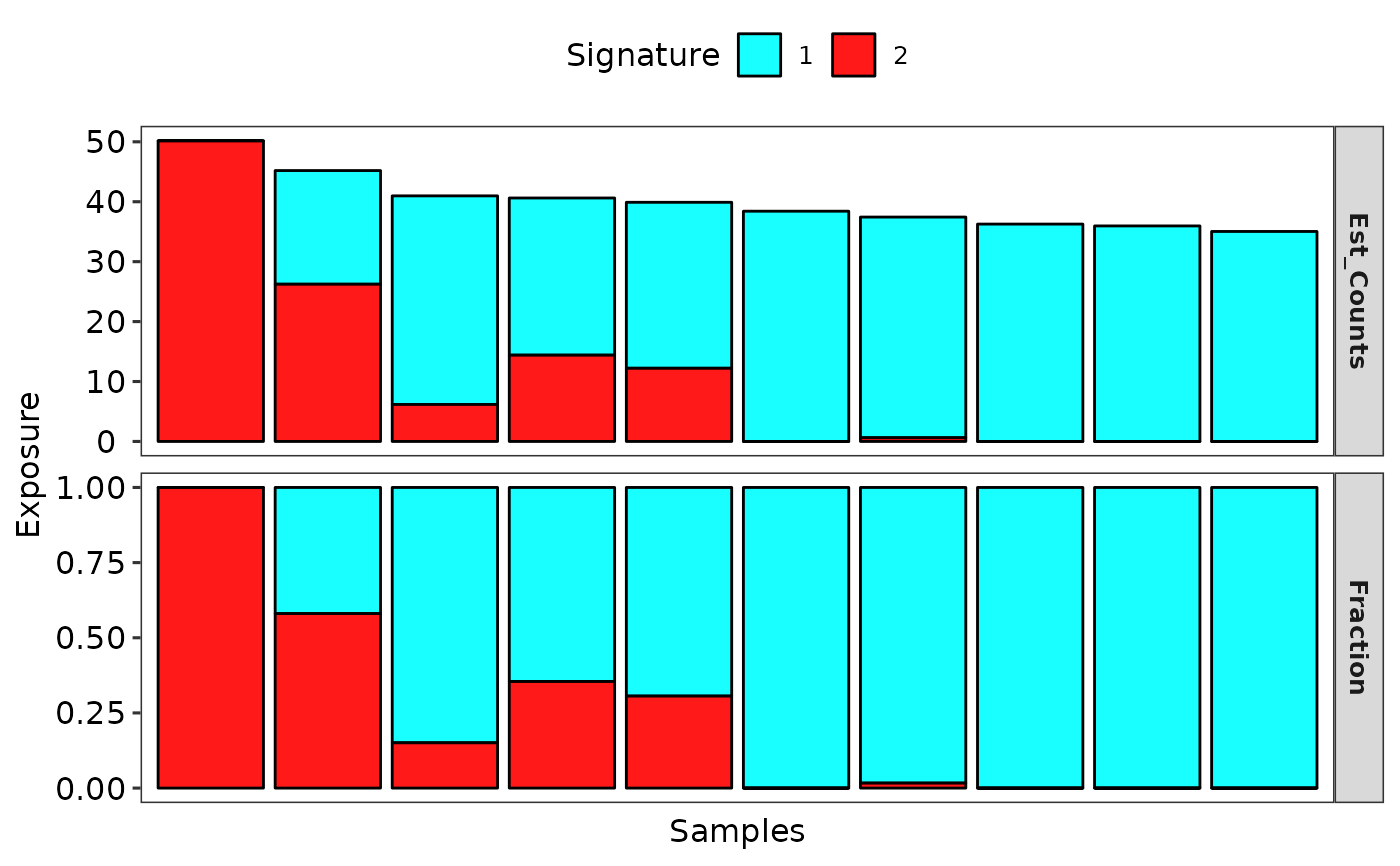
Currently support copy number signatures and mutational signatures.
show_sig_exposure(
  Signature,
  sig_names = NULL,
  groups = NULL,
  grp_order = NULL,
  grp_size = NULL,
  samps = NULL,
  cutoff = NULL,
  style = c("default", "cosmic"),
  palette = use_color_style(style),
  base_size = 12,
  font_scale = 1,
  rm_space = FALSE,
  rm_grid_line = TRUE,
  rm_panel_border = FALSE,
  hide_samps = TRUE,
  legend_position = "top"
)
Arguments
- Signature
a
Signatureobject obtained either from sig_extract or sig_auto_extract, or just a raw absolute exposure matrix with column representing samples (patients) and row representing signatures (signature names must end with different digital numbers, e.g. Sig1, Sig10, x12). If you named signatures with letters, you can specify them bysig_namesparameter.- sig_names
set name of signatures, can be a character vector.
- groups
sample groups, default is
NULL.- grp_order
order of groups, default is
NULL.- grp_size
font size of groups.
- samps
sample vector to filter samples or sort samples, default is
NULL.- cutoff
a cutoff value to remove hyper-mutated samples.
- style
plot style, one of 'default' and 'cosmic', works when parameter
set_gradient_colorisFALSE.- palette
palette used to plot, default use a built-in palette according to parameter
style.- base_size
overall font size.
- font_scale
a number used to set font scale.
- rm_space
default is
FALSE. IfTRUE, it will remove border color and expand the bar width to 1. This is useful when the sample size is big.- rm_grid_line
default is
FALSE, ifTRUE, remove grid lines of plot.- rm_panel_border
default is
TRUEfor style 'cosmic', remove panel border to keep plot tight.- hide_samps
if
TRUE, hide sample names.- legend_position
position of legend, default is 'top'.
Value
a ggplot object
Examples
# \donttest{
# Load mutational signature
load(system.file("extdata", "toy_mutational_signature.RData",
  package = "sigminer", mustWork = TRUE
))
# Show signature exposure
p1 <- show_sig_exposure(sig2)
p1


# Load copy number signature
load(system.file("extdata", "toy_copynumber_signature_by_W.RData",
  package = "sigminer", mustWork = TRUE
))
# Show signature exposure
p2 <- show_sig_exposure(sig)
p2

# }
# }