Draw Corrplot for Signature Exposures and Other Features
Source:R/show_sig_feature_corrplot.R
show_sig_feature_corrplot.RdThis function is for association visualization. Of note,
the parameters p_val and drop will affect the visualization
of association results under p value threshold.
show_sig_feature_corrplot(
  tidy_cor,
  feature_list,
  sort_features = FALSE,
  sig_orders = NULL,
  drop = TRUE,
  return_plotlist = FALSE,
  p_val = 0.05,
  xlab = "Signatures",
  ylab = "Features",
  co_gradient_colors = scale_color_gradient2(low = "blue", mid = "white", high = "red",
    midpoint = 0),
  ca_gradient_colors = co_gradient_colors,
  plot_ratio = "auto",
  breaks_count = NULL
)
Arguments
- tidy_cor
data returned by get_tidy_association.
- feature_list
a character vector contains features want to be plotted. If missing, all features will be used.
- sort_features
default is
FALSE, use feature order obtained from the previous step. IfTRUE, sort features asfeature_list.- sig_orders
signature levels for ordering.
- drop
if
TRUE, when a feature has no association with all signatures (p value larger than threshold set byp_val), this feature will be removed from the plot. Otherwise, this feature (a row) will keep with all blank white.- return_plotlist
if
TRUE, return as a list ofggplotobjects.- p_val
p value threshold. If p value larger than this threshold, the result becomes blank white.
- xlab
label for x axis.
- ylab
label for y axis.
- co_gradient_colors
a Scale object representing gradient colors used to plot for continuous features.
- ca_gradient_colors
a Scale object representing gradient colors used to plot for categorical features.
- plot_ratio
a length-2 numeric vector to set the height/width ratio.
- breaks_count
breaks for sample count. If set it to
NULL, ggplotbinscale will be used to automatically determine the breaks. If set it toNA,aesfor sample will be not used.
Value
a ggplot2 object
See also
Examples
# \donttest{
# The data is generated from Wang, Shixiang et al.
load(system.file("extdata", "asso_data.RData",
package = "sigminer", mustWork = TRUE
))
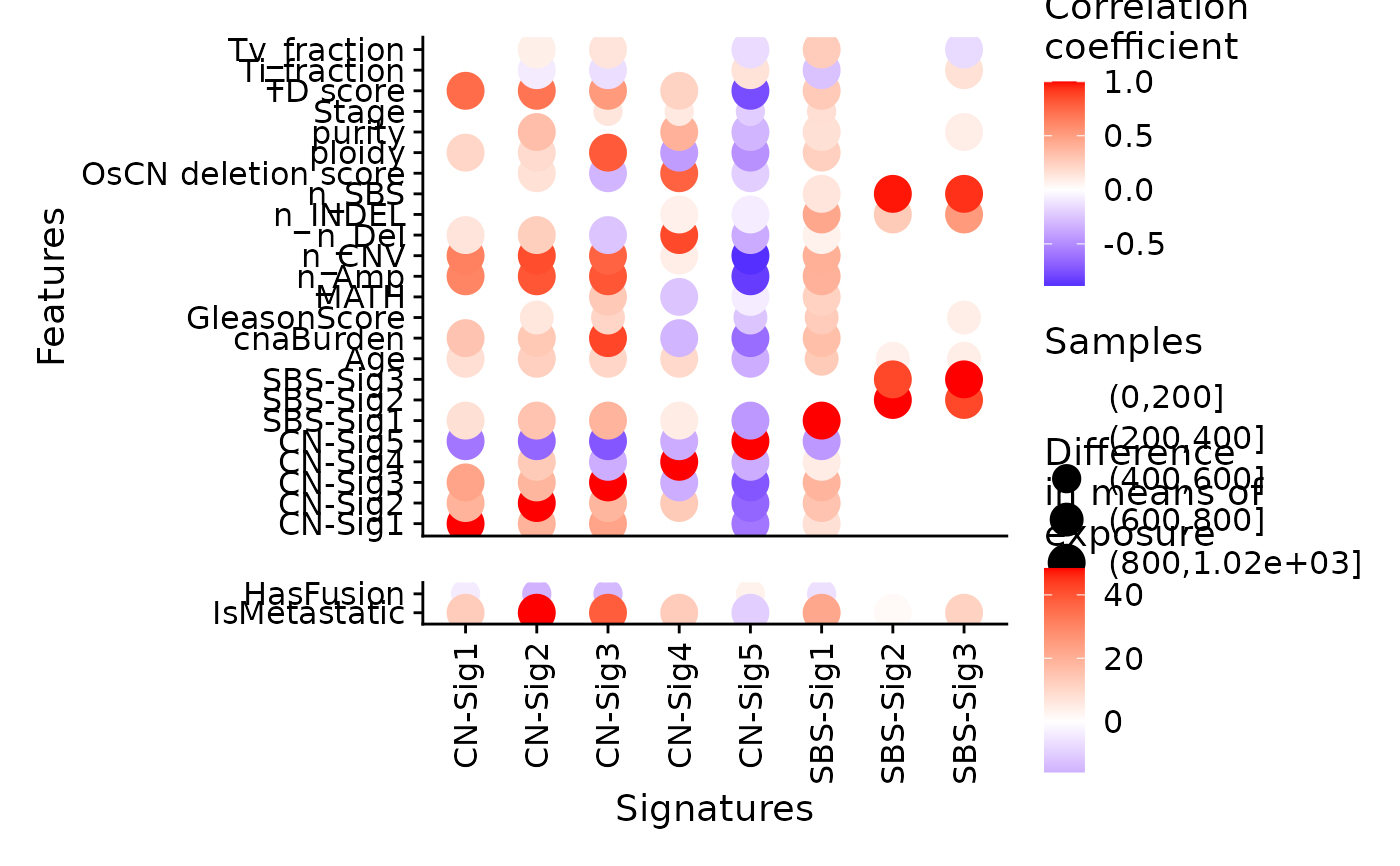
p <- show_sig_feature_corrplot(
tidy_data.seqz.feature,
p_val = 0.05,
breaks_count = c(0L,200L, 400L, 600L, 800L, 1020L))
#> Warning: There were 2 warnings in `dplyr::mutate()`.
#> The first warning was:
#> ℹ In argument: `gg = purrr::map2(.data$data, .data$type, .plot_cor)`.
#> ℹ In group 1: `type = "ca"`.
#> Caused by warning:
#> ! Using size for a discrete variable is not advised.
#> ℹ Run `dplyr::last_dplyr_warnings()` to see the 1 remaining warning.
p
 # }
# }