All variables must be continuous.
The matrix will be returned as an element of ggplot object.
This is basically a wrapper of R package
ggcorrplot.
show_cor(
  data,
  x_vars = colnames(data),
  y_vars = x_vars,
  cor_method = "spearman",
  vis_method = "square",
  lab = TRUE,
  test = TRUE,
  hc_order = FALSE,
  p_adj = NULL,
  ...
)
Arguments
- data
a
data.frame.- x_vars
variables/column names shown in x axis.
- y_vars
variables/column names shown in y axis.
- cor_method
method for correlation, default is 'spearman'.
- vis_method
visualization method, default is 'square', can also be 'circle'.
- lab
logical value. If TRUE, add correlation coefficient on the plot.
- test
if
TRUE, run test for correlation and mark significance.- hc_order
logical value. If
TRUE, correlation matrix will be hc.ordered usinghclustfunction.- p_adj
p adjust method, see stats::p.adjust for details.
- ...
other parameters passing to
ggcorrplot::ggcorrplot().
Value
a ggplot object
See also
show_sig_feature_corrplot for specific and more powerful association analysis and visualization.
Examples
data("mtcars")
p1 <- show_cor(mtcars)
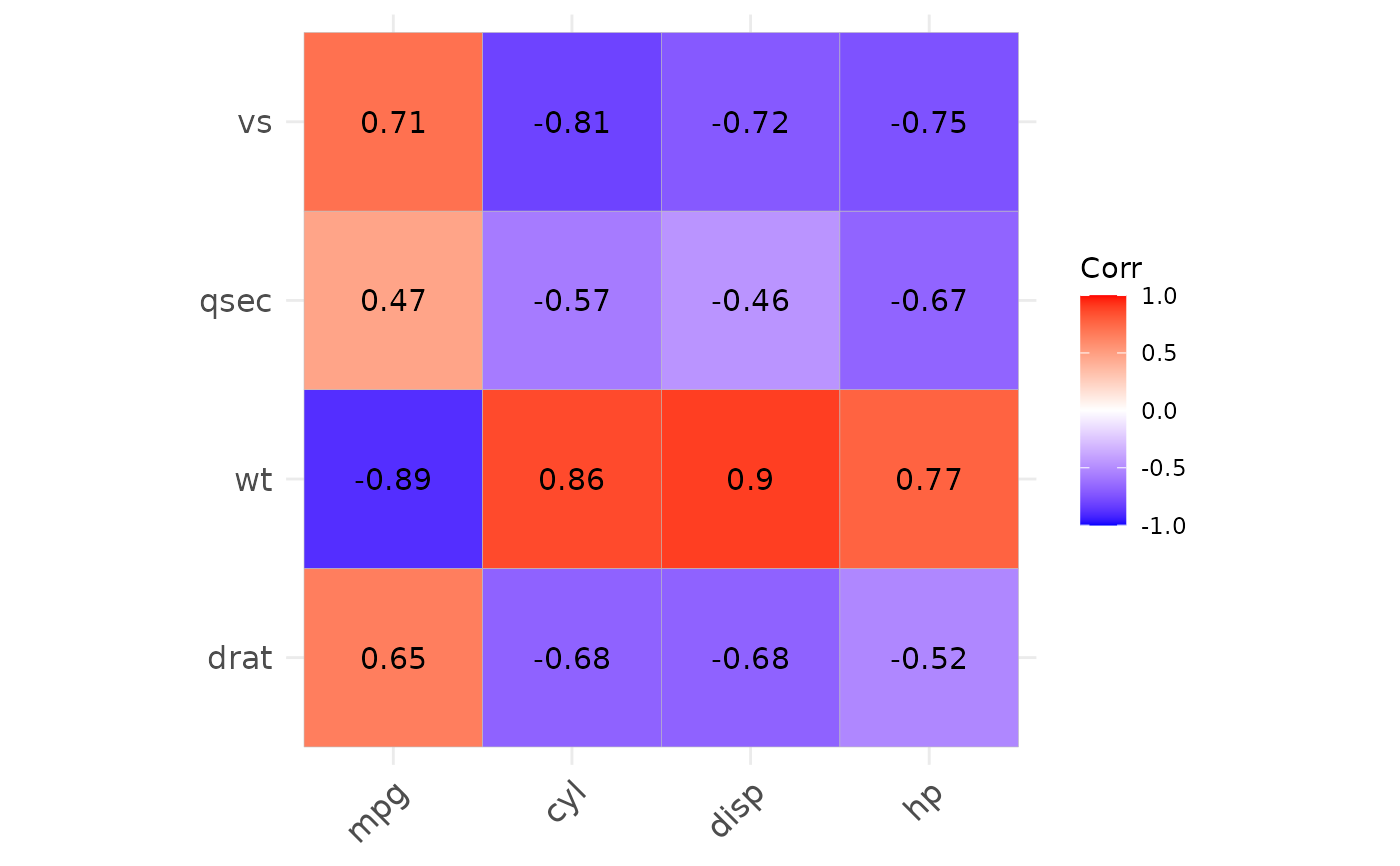
p2 <- show_cor(mtcars,
x_vars = colnames(mtcars)[1:4],
y_vars = colnames(mtcars)[5:8]
)
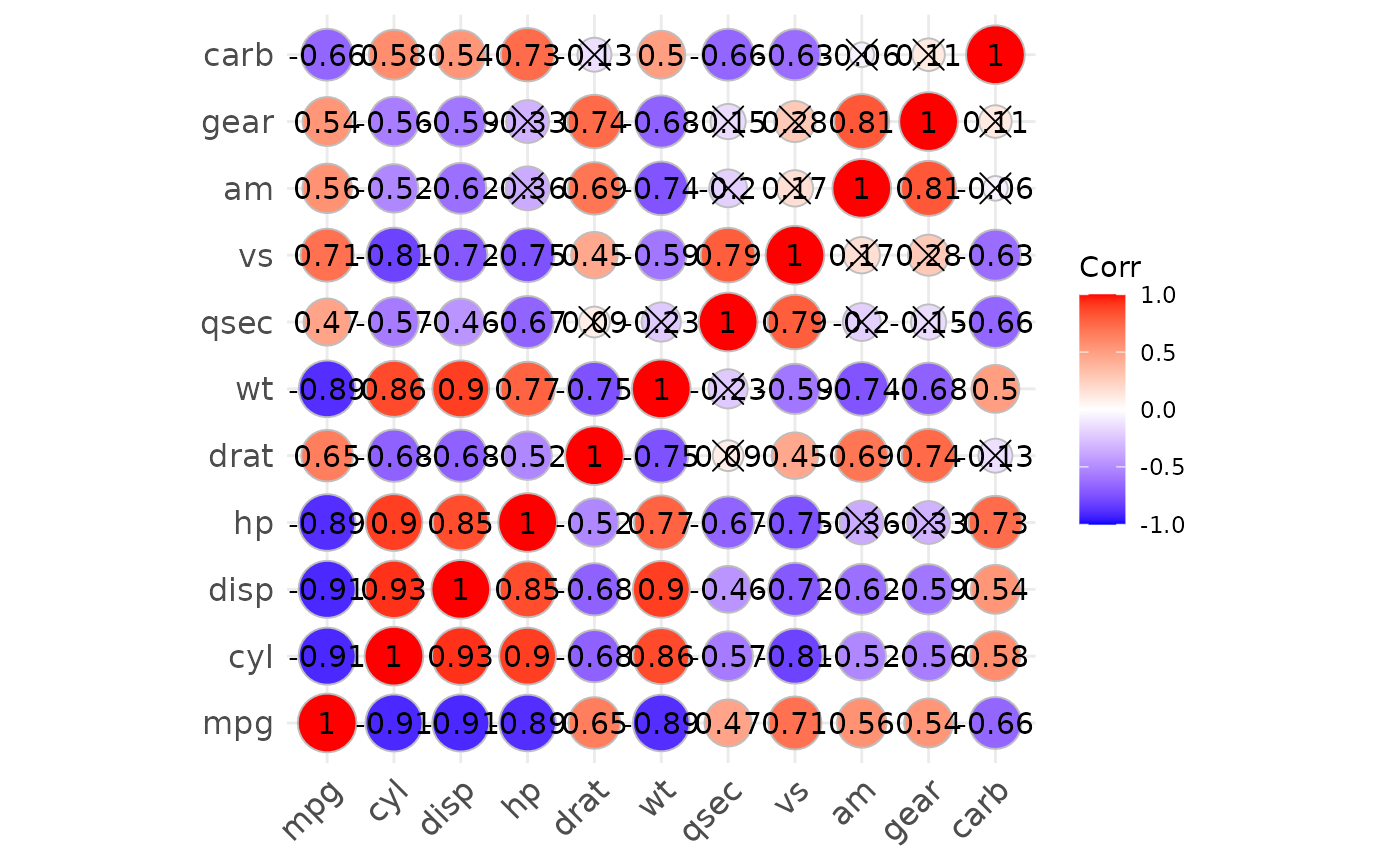
p3 <- show_cor(mtcars, vis_method = "circle", p_adj = "fdr")
p1
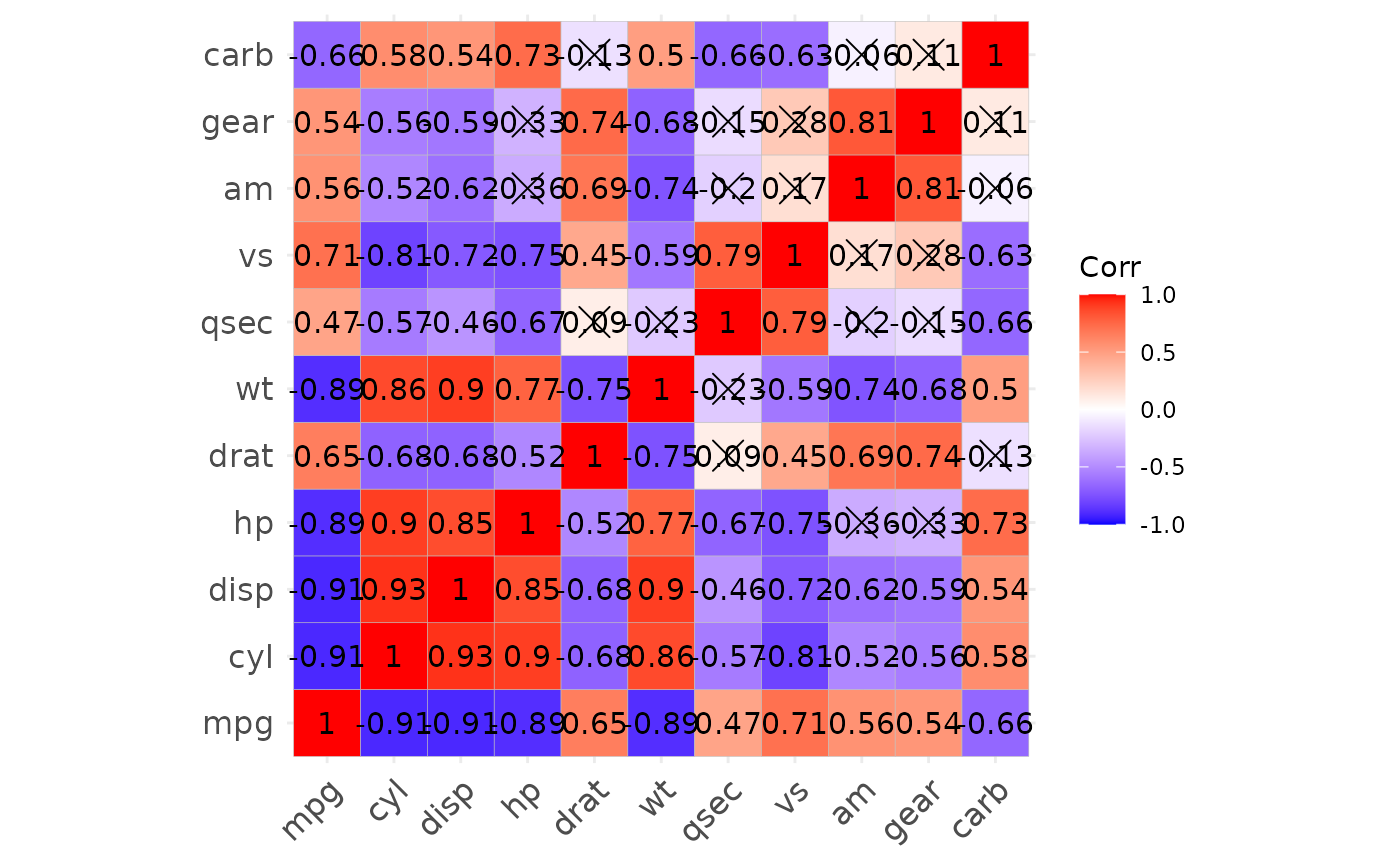 p1$cor
#> $cor_mat
#> mpg cyl disp hp drat wt qsec vs am gear carb
#> mpg 1.00 -0.91 -0.91 -0.89 0.65 -0.89 0.47 0.71 0.56 0.54 -0.66
#> cyl -0.91 1.00 0.93 0.90 -0.68 0.86 -0.57 -0.81 -0.52 -0.56 0.58
#> disp -0.91 0.93 1.00 0.85 -0.68 0.90 -0.46 -0.72 -0.62 -0.59 0.54
#> hp -0.89 0.90 0.85 1.00 -0.52 0.77 -0.67 -0.75 -0.36 -0.33 0.73
#> drat 0.65 -0.68 -0.68 -0.52 1.00 -0.75 0.09 0.45 0.69 0.74 -0.13
#> wt -0.89 0.86 0.90 0.77 -0.75 1.00 -0.23 -0.59 -0.74 -0.68 0.50
#> qsec 0.47 -0.57 -0.46 -0.67 0.09 -0.23 1.00 0.79 -0.20 -0.15 -0.66
#> vs 0.71 -0.81 -0.72 -0.75 0.45 -0.59 0.79 1.00 0.17 0.28 -0.63
#> am 0.56 -0.52 -0.62 -0.36 0.69 -0.74 -0.20 0.17 1.00 0.81 -0.06
#> gear 0.54 -0.56 -0.59 -0.33 0.74 -0.68 -0.15 0.28 0.81 1.00 0.11
#> carb -0.66 0.58 0.54 0.73 -0.13 0.50 -0.66 -0.63 -0.06 0.11 1.00
#>
#> $p_mat
#> mpg cyl disp hp drat
#> mpg 0.000000e+00 6.112687e-10 9.380327e-10 1.787835e-07 1.776240e-05
#> cyl 6.112687e-10 0.000000e+00 1.802838e-12 3.477861e-09 8.244636e-06
#> disp 9.380327e-10 1.802838e-12 0.000000e+00 7.142679e-08 5.282022e-06
#> hp 1.787835e-07 3.477861e-09 7.142679e-08 0.000000e+00 9.988772e-03
#> drat 1.776240e-05 8.244636e-06 5.282022e-06 9.988772e-03 0.000000e+00
#> wt 1.293959e-10 1.217567e-07 1.222320e-11 4.145827e-05 4.784260e-06
#> qsec 1.708199e-02 3.660533e-04 1.314404e-02 5.766253e-06 6.195826e-01
#> vs 3.415937e-05 1.843018e-08 5.235012e-06 2.940896e-06 1.167553e-02
#> am 2.850207e-04 2.151207e-03 3.662114e-04 1.798309e-01 4.726790e-06
#> gear 5.400948e-03 4.173297e-03 9.635921e-04 4.930119e-01 8.360110e-06
#> carb 1.084446e-03 1.942340e-03 2.526789e-02 7.827810e-07 6.211834e-01
#> wt qsec vs am gear
#> mpg 1.293959e-10 1.708199e-02 3.415937e-05 2.850207e-04 5.400948e-03
#> cyl 1.217567e-07 3.660533e-04 1.843018e-08 2.151207e-03 4.173297e-03
#> disp 1.222320e-11 1.314404e-02 5.235012e-06 3.662114e-04 9.635921e-04
#> hp 4.145827e-05 5.766253e-06 2.940896e-06 1.798309e-01 4.930119e-01
#> drat 4.784260e-06 6.195826e-01 1.167553e-02 4.726790e-06 8.360110e-06
#> wt 0.000000e+00 3.388683e-01 9.798492e-04 1.125440e-05 4.586601e-04
#> qsec 3.388683e-01 0.000000e+00 1.029669e-06 2.056621e-01 2.425344e-01
#> vs 9.798492e-04 1.029669e-06 0.000000e+00 3.570439e-01 2.579439e-01
#> am 1.125440e-05 2.056621e-01 3.570439e-01 0.000000e+00 5.834043e-08
#> gear 4.586601e-04 2.425344e-01 2.579439e-01 5.834043e-08 0.000000e+00
#> carb 1.463861e-02 4.536949e-05 6.670496e-04 7.544526e-01 1.290291e-01
#> carb
#> mpg 1.084446e-03
#> cyl 1.942340e-03
#> disp 2.526789e-02
#> hp 7.827810e-07
#> drat 6.211834e-01
#> wt 1.463861e-02
#> qsec 4.536949e-05
#> vs 6.670496e-04
#> am 7.544526e-01
#> gear 1.290291e-01
#> carb 0.000000e+00
#>
p2
p1$cor
#> $cor_mat
#> mpg cyl disp hp drat wt qsec vs am gear carb
#> mpg 1.00 -0.91 -0.91 -0.89 0.65 -0.89 0.47 0.71 0.56 0.54 -0.66
#> cyl -0.91 1.00 0.93 0.90 -0.68 0.86 -0.57 -0.81 -0.52 -0.56 0.58
#> disp -0.91 0.93 1.00 0.85 -0.68 0.90 -0.46 -0.72 -0.62 -0.59 0.54
#> hp -0.89 0.90 0.85 1.00 -0.52 0.77 -0.67 -0.75 -0.36 -0.33 0.73
#> drat 0.65 -0.68 -0.68 -0.52 1.00 -0.75 0.09 0.45 0.69 0.74 -0.13
#> wt -0.89 0.86 0.90 0.77 -0.75 1.00 -0.23 -0.59 -0.74 -0.68 0.50
#> qsec 0.47 -0.57 -0.46 -0.67 0.09 -0.23 1.00 0.79 -0.20 -0.15 -0.66
#> vs 0.71 -0.81 -0.72 -0.75 0.45 -0.59 0.79 1.00 0.17 0.28 -0.63
#> am 0.56 -0.52 -0.62 -0.36 0.69 -0.74 -0.20 0.17 1.00 0.81 -0.06
#> gear 0.54 -0.56 -0.59 -0.33 0.74 -0.68 -0.15 0.28 0.81 1.00 0.11
#> carb -0.66 0.58 0.54 0.73 -0.13 0.50 -0.66 -0.63 -0.06 0.11 1.00
#>
#> $p_mat
#> mpg cyl disp hp drat
#> mpg 0.000000e+00 6.112687e-10 9.380327e-10 1.787835e-07 1.776240e-05
#> cyl 6.112687e-10 0.000000e+00 1.802838e-12 3.477861e-09 8.244636e-06
#> disp 9.380327e-10 1.802838e-12 0.000000e+00 7.142679e-08 5.282022e-06
#> hp 1.787835e-07 3.477861e-09 7.142679e-08 0.000000e+00 9.988772e-03
#> drat 1.776240e-05 8.244636e-06 5.282022e-06 9.988772e-03 0.000000e+00
#> wt 1.293959e-10 1.217567e-07 1.222320e-11 4.145827e-05 4.784260e-06
#> qsec 1.708199e-02 3.660533e-04 1.314404e-02 5.766253e-06 6.195826e-01
#> vs 3.415937e-05 1.843018e-08 5.235012e-06 2.940896e-06 1.167553e-02
#> am 2.850207e-04 2.151207e-03 3.662114e-04 1.798309e-01 4.726790e-06
#> gear 5.400948e-03 4.173297e-03 9.635921e-04 4.930119e-01 8.360110e-06
#> carb 1.084446e-03 1.942340e-03 2.526789e-02 7.827810e-07 6.211834e-01
#> wt qsec vs am gear
#> mpg 1.293959e-10 1.708199e-02 3.415937e-05 2.850207e-04 5.400948e-03
#> cyl 1.217567e-07 3.660533e-04 1.843018e-08 2.151207e-03 4.173297e-03
#> disp 1.222320e-11 1.314404e-02 5.235012e-06 3.662114e-04 9.635921e-04
#> hp 4.145827e-05 5.766253e-06 2.940896e-06 1.798309e-01 4.930119e-01
#> drat 4.784260e-06 6.195826e-01 1.167553e-02 4.726790e-06 8.360110e-06
#> wt 0.000000e+00 3.388683e-01 9.798492e-04 1.125440e-05 4.586601e-04
#> qsec 3.388683e-01 0.000000e+00 1.029669e-06 2.056621e-01 2.425344e-01
#> vs 9.798492e-04 1.029669e-06 0.000000e+00 3.570439e-01 2.579439e-01
#> am 1.125440e-05 2.056621e-01 3.570439e-01 0.000000e+00 5.834043e-08
#> gear 4.586601e-04 2.425344e-01 2.579439e-01 5.834043e-08 0.000000e+00
#> carb 1.463861e-02 4.536949e-05 6.670496e-04 7.544526e-01 1.290291e-01
#> carb
#> mpg 1.084446e-03
#> cyl 1.942340e-03
#> disp 2.526789e-02
#> hp 7.827810e-07
#> drat 6.211834e-01
#> wt 1.463861e-02
#> qsec 4.536949e-05
#> vs 6.670496e-04
#> am 7.544526e-01
#> gear 1.290291e-01
#> carb 0.000000e+00
#>
p2
 p3
p3
 ## Auto detect problem variables
mtcars$xx <- 0L
p4 <- show_cor(mtcars)
#> Problem variables with sd=0 detected: xx
#> They will be removed.
p4
## Auto detect problem variables
mtcars$xx <- 0L
p4 <- show_cor(mtcars)
#> Problem variables with sd=0 detected: xx
#> They will be removed.
p4
