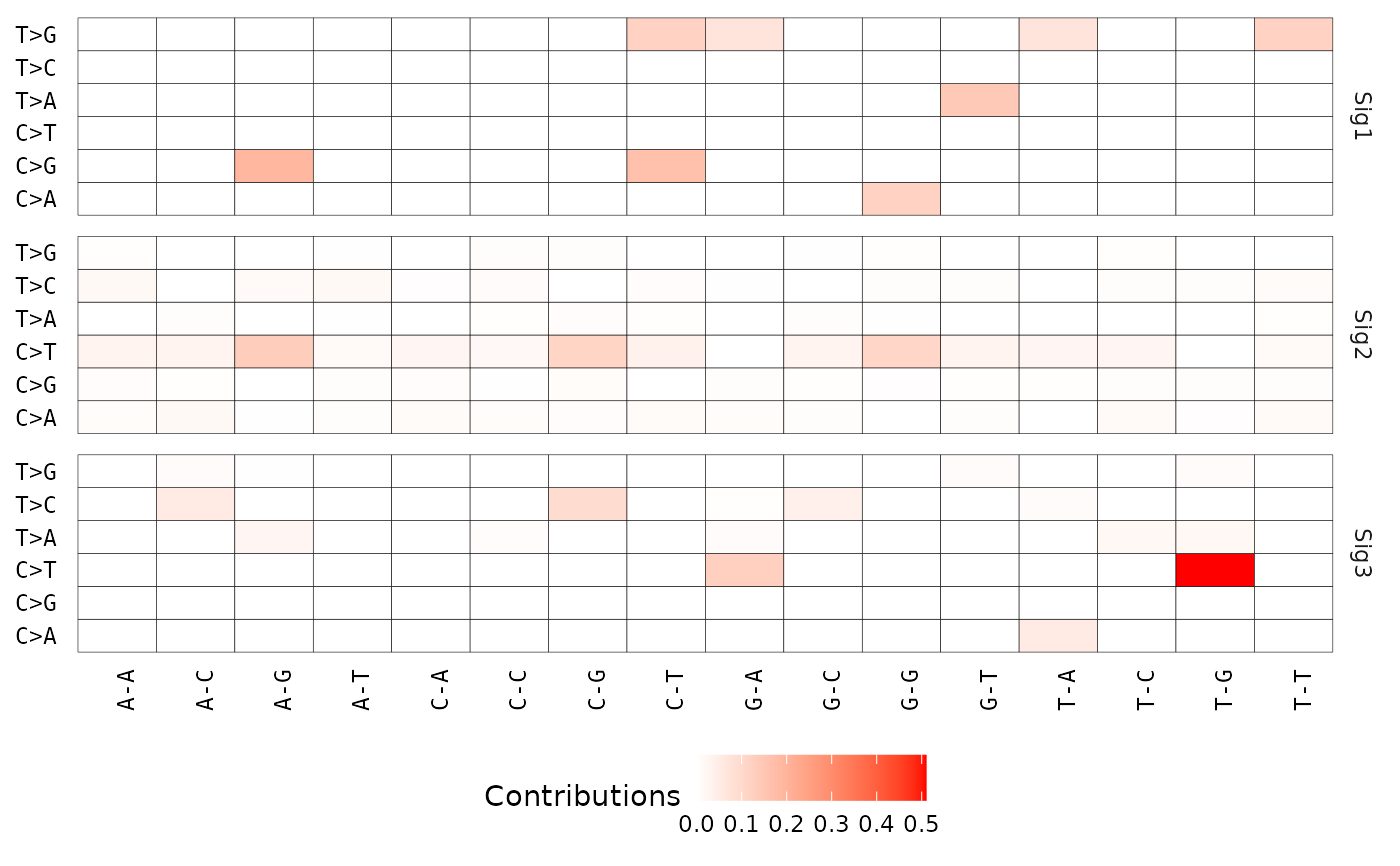
Show Signature Profile with Heatmap
Source:R/show_sig_profile_heatmap.R
show_sig_profile_heatmap.RdThis is a complementary function to show_sig_profile(), it is used for visualizing
some big signatures, i.e. SBS-1536, not all signatures are supported. See details for
current supported signatures.
show_sig_profile_heatmap(
  Signature,
  mode = c("SBS", "DBS"),
  normalize = c("row", "column", "raw"),
  filters = NULL,
  x_lab = NULL,
  y_lab = NULL,
  legend_name = "auto",
  palette = "red",
  x_label_angle = 90,
  x_label_vjust = 1,
  x_label_hjust = 0.5,
  y_label_angle = 0,
  y_label_vjust = 0.5,
  y_label_hjust = 1,
  flip_xy = FALSE,
  sig_names = NULL,
  sig_orders = NULL,
  check_sig_names = TRUE
)
Arguments
- Signature
a
Signatureobject obtained either from sig_extract or sig_auto_extract, or just a raw signature matrix with row representing components (motifs) and column representing signatures (column names must start with 'Sig').- mode
one of "SBS" and "DBS".
- normalize
one of 'row', 'column', 'raw' and "feature", for row normalization (signature), column normalization (component), raw data, row normalization by feature, respectively. Of note, 'feature' only works when the mode is 'copynumber'.
- filters
a pattern used to select components to plot.
- x_lab
x label.
- y_lab
y label.
- legend_name
name of figure legend.
- palette
color for value.
- x_label_angle
angle for x axis text.
- x_label_vjust
vjust for x axis text.
- x_label_hjust
hjust for x axis text.
- y_label_angle
angle for y axis text.
- y_label_vjust
vjust for y axis text.
- y_label_hjust
hjust for y axis text.
- flip_xy
if
TRUE, flip x axis and y axis.- sig_names
subset signatures or set name of signatures, can be a character vector. Default is
NULL, prefix 'Sig' plus number is used.- sig_orders
set order of signatures, can be a character vector. Default is
NULL, the signatures are ordered by alphabetical order. If an integer vector set, only specified signatures are plotted.- check_sig_names
if
TRUE, check signature names when input is a matrix, i.e., all signatures (colnames) must start with 'Sig'.
Value
a ggplot object.
Details
Support:
SBS-24
SBS-96
SBS-384
SBS-1536
SBS-6144
DBS-78
DBS-186
Examples
# \donttest{
# Load SBS signature
load(system.file("extdata", "toy_mutational_signature.RData",
  package = "sigminer", mustWork = TRUE
))
# Show signature profile
p1 <- show_sig_profile_heatmap(sig2, mode = "SBS")
p1

# }
# }