Who don't like to show a barplot for signature profile? This is for it.
show_sig_profile(
  Signature,
  mode = c("SBS", "copynumber", "DBS", "ID", "RS"),
  method = "Wang",
  by_context = FALSE,
  normalize = c("row", "column", "raw", "feature"),
  y_tr = NULL,
  filters = NULL,
  feature_setting = sigminer::CN.features,
  style = c("default", "cosmic"),
  palette = use_color_style(style, ifelse(by_context, "SBS", mode), method),
  set_gradient_color = FALSE,
  free_space = "free_x",
  rm_panel_border = style == "cosmic",
  rm_grid_line = style == "cosmic",
  rm_axis_text = FALSE,
  bar_border_color = ifelse(style == "default", "grey50", "white"),
  bar_width = 0.7,
  paint_axis_text = TRUE,
  x_label_angle = ifelse(mode == "copynumber" & !(startsWith(method, "T") | method ==
    "X"), 60, 90),
  x_label_vjust = ifelse(mode == "copynumber" & !(startsWith(method, "T") | method ==
    "X"), 1, 0.5),
  x_label_hjust = 1,
  x_lab = "Components",
  y_lab = "auto",
  y_limits = NULL,
  params = NULL,
  show_cv = FALSE,
  params_label_size = 3,
  params_label_angle = 60,
  y_expand = 1,
  digits = 2,
  base_size = 12,
  font_scale = 1,
  sig_names = NULL,
  sig_orders = NULL,
  check_sig_names = TRUE
)
Arguments
- Signature
a
Signatureobject obtained either from sig_extract or sig_auto_extract, or just a raw signature matrix with row representing components (motifs) and column representing signatures (column names must start with 'Sig').- mode
signature type for plotting, now supports 'copynumber', 'SBS', 'DBS', 'ID' and 'RS' (genome rearrangement signature).
- method
method for copy number feature classification in sig_tally, can be one of "Wang" ("W"), "S".
- by_context
for specific use.
- normalize
one of 'row', 'column', 'raw' and "feature", for row normalization (signature), column normalization (component), raw data, row normalization by feature, respectively. Of note, 'feature' only works when the mode is 'copynumber'.
- y_tr
a function (e.g.
log10) to transform y axis before plotting.- filters
a pattern used to select components to plot.
- feature_setting
a
data.frameused for classification. Only used when method is "Wang" ("W"). Default is CN.features. Users can also set custom input with "feature", "min" and "max" columns available. Valid features can be printed byunique(CN.features$feature).- style
plot style, one of 'default' and 'cosmic', works when parameter
set_gradient_colorisFALSE.- palette
palette used to plot when
set_gradient_colorisFALSE, default use a built-in palette according to parameterstyle.- set_gradient_color
default is
FALSE, ifTRUE, use gradient colors to fill bars.- free_space
default is 'free_x'. If "fixed", all panels have the same size. If "free_y" their height will be proportional to the length of the y scale; if "free_x" their width will be proportional to the length of the x scale; or if "free" both height and width will vary. This setting has no effect unless the appropriate scales also vary.
- rm_panel_border
default is
TRUEfor style 'cosmic', remove panel border to keep plot tight.- rm_grid_line
default is
FALSE, ifTRUE, remove grid lines of plot.- rm_axis_text
default is
FALSE, ifTRUE, remove component texts. This is useful when multiple signature profiles are plotted together.- bar_border_color
the color of bar border.
- bar_width
bar width. By default, set to 70% of the resolution of the data.
- paint_axis_text
if
TRUE, color on text of x axis.- x_label_angle
font angle for x label.
- x_label_vjust
font vjust for x label.
- x_label_hjust
font hjust for x label.
- x_lab
x axis lab.
- y_lab
y axis lab.
- y_limits
limits to expand in y axis. e.g.,
0.2,c(0, 0.3).- params
params
data.frameof components, obtained from sig_tally.- show_cv
default is
FALSE, ifTRUE, show coefficient of variation whenparamsis notNULL.- params_label_size
font size for params label.
- params_label_angle
font angle for params label.
- y_expand
y expand height for plotting params of copy number signatures.
- digits
digits for plotting params of copy number signatures.
- base_size
overall font size.
- font_scale
a number used to set font scale.
- sig_names
subset signatures or set name of signatures, can be a character vector. Default is
NULL, prefix 'Sig' plus number is used.- sig_orders
set order of signatures, can be a character vector. Default is
NULL, the signatures are ordered by alphabetical order. If an integer vector set, only specified signatures are plotted.- check_sig_names
if
TRUE, check signature names when input is a matrix, i.e., all signatures (colnames) must start with 'Sig'.
Value
a ggplot object
Examples
# \donttest{
# Load SBS signature
load(system.file("extdata", "toy_mutational_signature.RData",
package = "sigminer", mustWork = TRUE
))
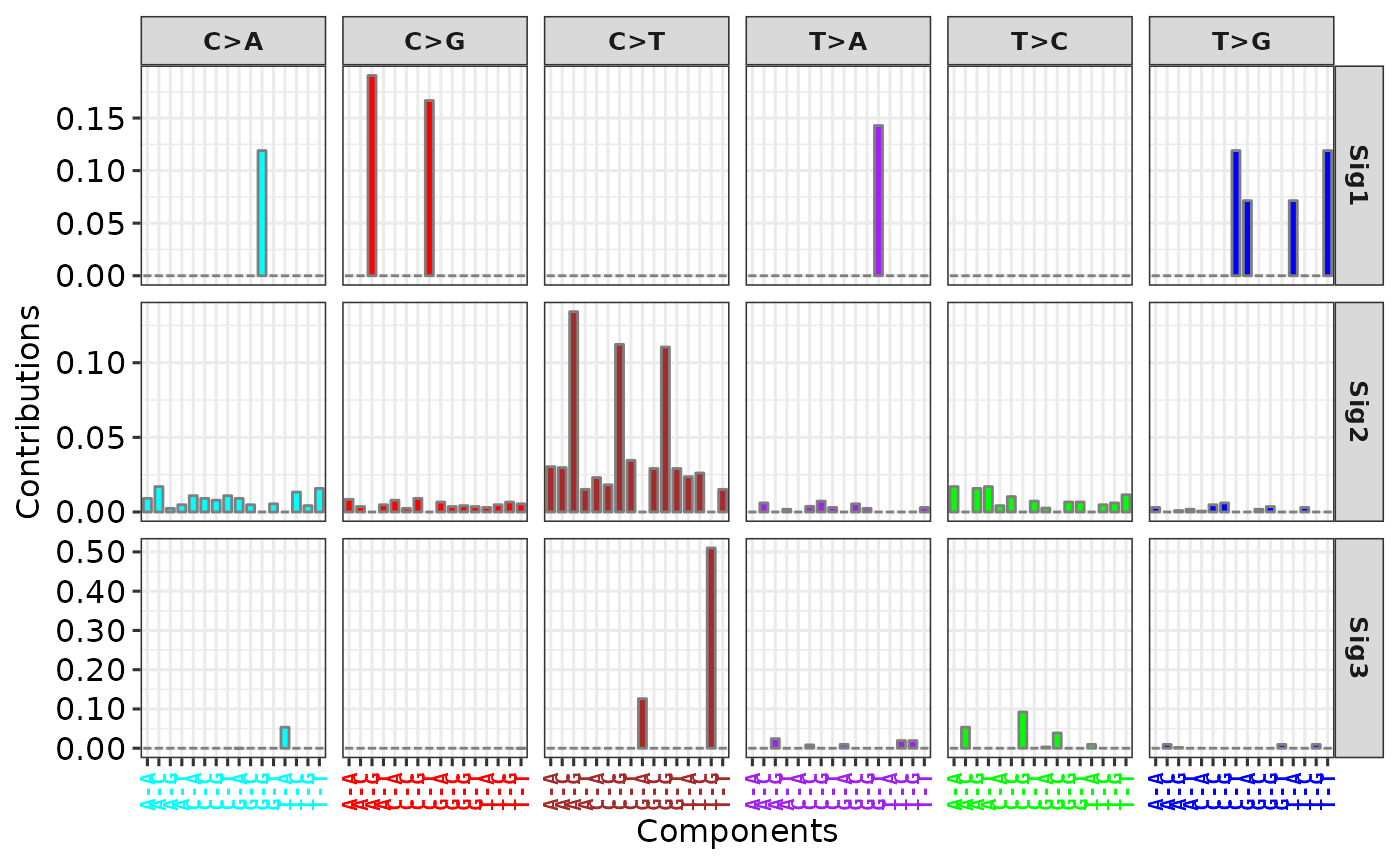
# Show signature profile
p1 <- show_sig_profile(sig2, mode = "SBS")
p1
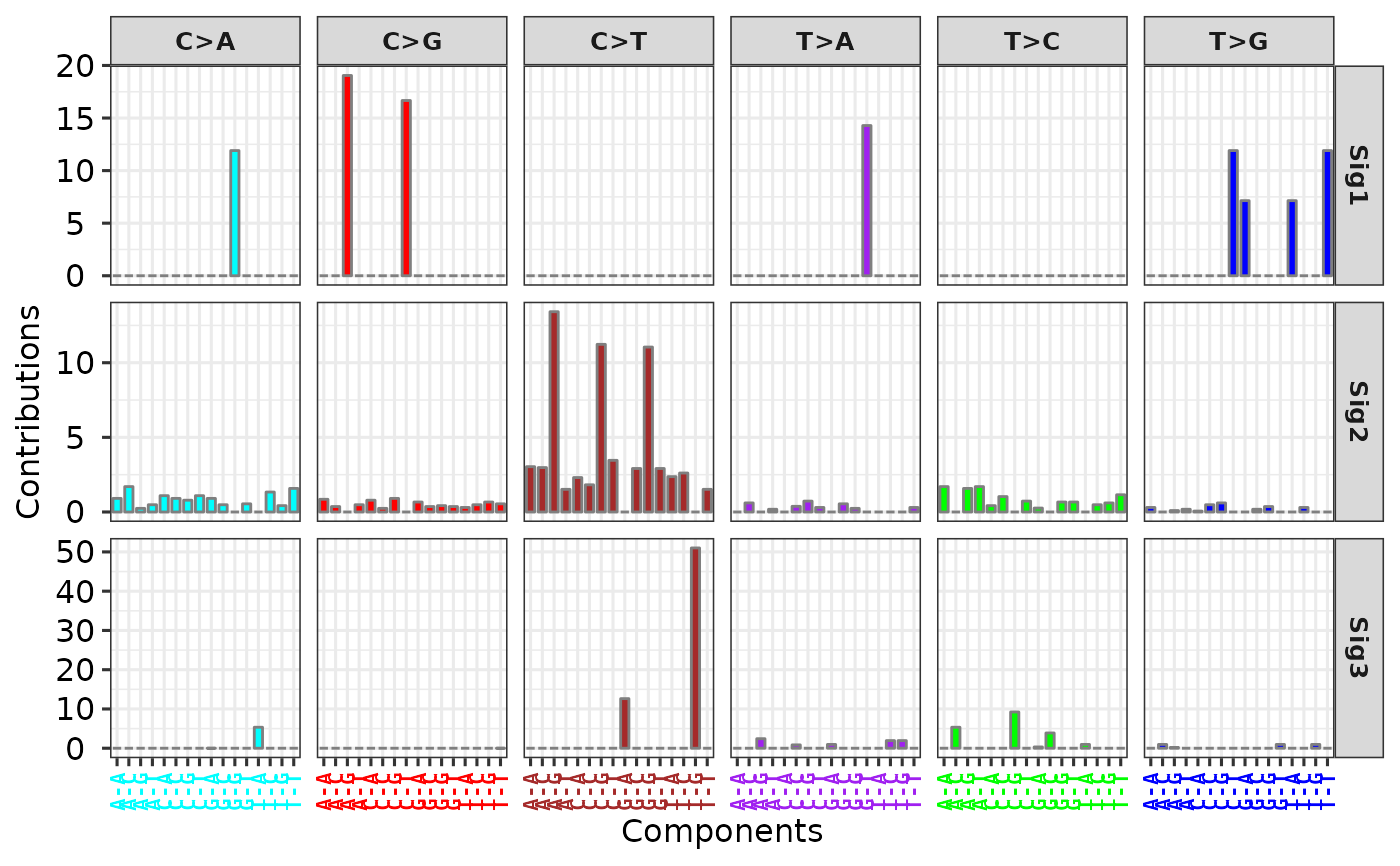
 # Use 'y_tr' option to transform values in y axis
p11 <- show_sig_profile(sig2, mode = "SBS", y_tr = function(x) x * 100)
p11
# Use 'y_tr' option to transform values in y axis
p11 <- show_sig_profile(sig2, mode = "SBS", y_tr = function(x) x * 100)
p11
 # Load copy number signature from method "W"
load(system.file("extdata", "toy_copynumber_signature_by_W.RData",
package = "sigminer", mustWork = TRUE
))
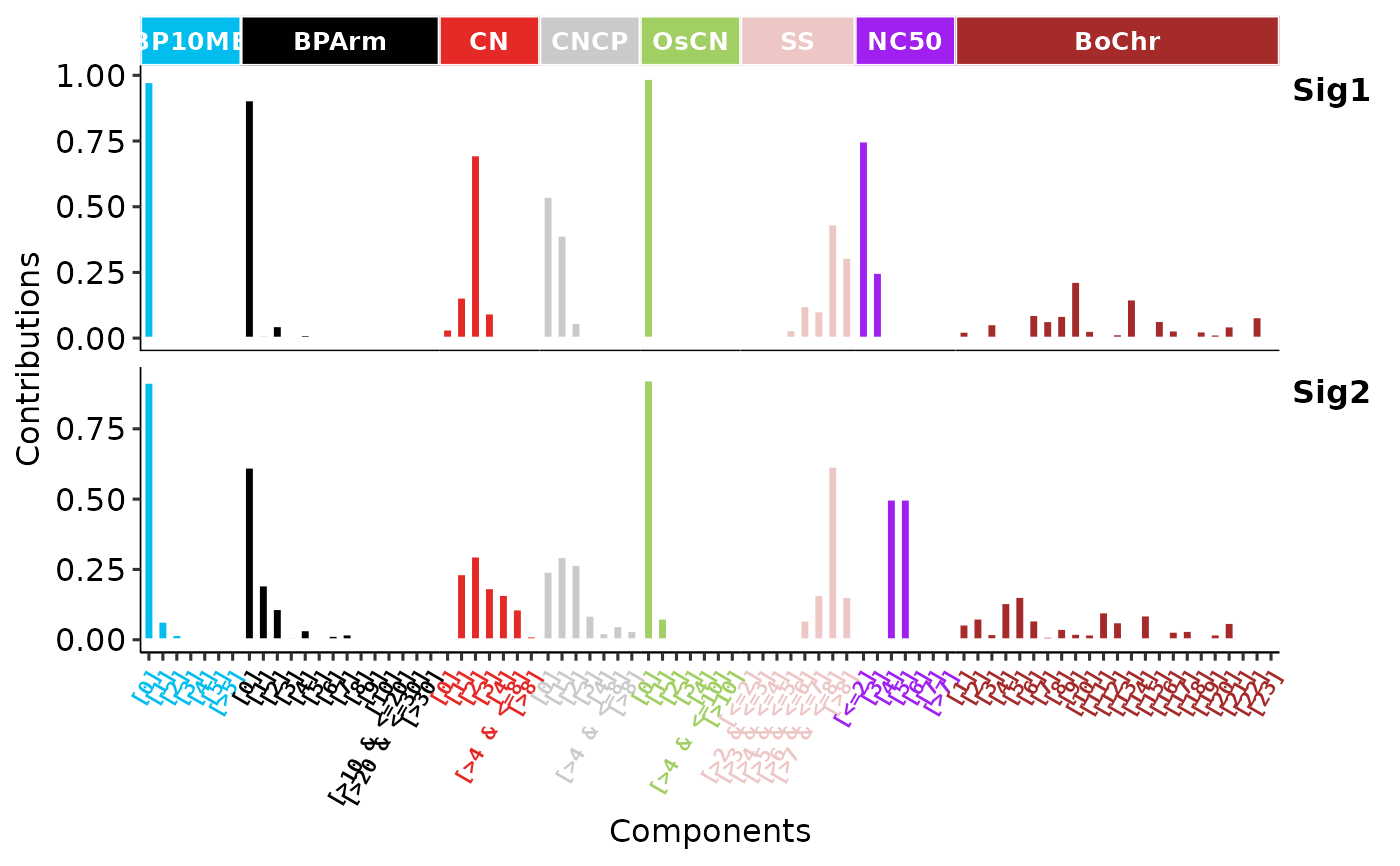
# Show signature profile
p2 <- show_sig_profile(sig,
style = "cosmic",
mode = "copynumber",
method = "W",
normalize = "feature"
)
p2
# Load copy number signature from method "W"
load(system.file("extdata", "toy_copynumber_signature_by_W.RData",
package = "sigminer", mustWork = TRUE
))
# Show signature profile
p2 <- show_sig_profile(sig,
style = "cosmic",
mode = "copynumber",
method = "W",
normalize = "feature"
)
p2
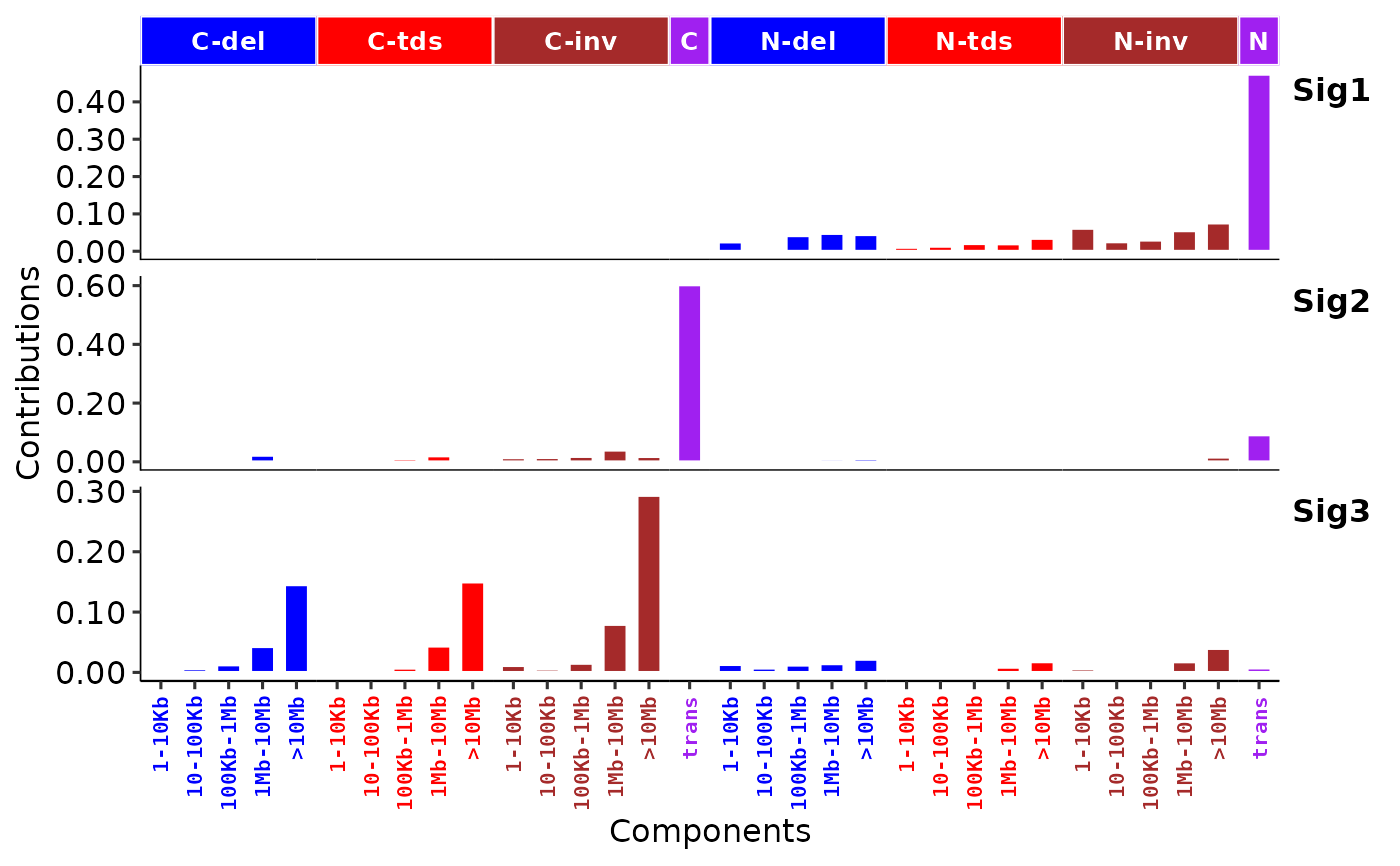
 # Visualize rearrangement signatures
s <- get_sig_db("RS_Nik_lab")
ss <- s$db[, 1:3]
colnames(ss) <- c("Sig1", "Sig2", "Sig3")
p3 <- show_sig_profile(ss, mode = "RS", style = "cosmic")
p3
# Visualize rearrangement signatures
s <- get_sig_db("RS_Nik_lab")
ss <- s$db[, 1:3]
colnames(ss) <- c("Sig1", "Sig2", "Sig3")
p3 <- show_sig_profile(ss, mode = "RS", style = "cosmic")
p3
 # }
# }