Group Cox Analysis and Visualization
ezcox_group(
  data,
  grp_var,
  covariate,
  controls = NULL,
  time = "time",
  status = "status",
  sort = FALSE,
  decreasing = TRUE,
  add_all = FALSE,
  add_caption = TRUE,
  verbose = TRUE,
  headings = list(variable = "Group", n = "N", measure = "Hazard ratio", ci = NULL, p =
    "p"),
  ...
)
Arguments
- data
a
data.framecontaining variables, time and os status.- grp_var
a group column.
- covariate
a covariable for cox analysis.
- controls
column names specifying controls. The names with pattern "*:|()" will be treated as interaction/combination term, please make sure all column names in
dataare valid R variable names.- time
column name specifying time, default is 'time'.
- status
column name specifying event status, default is 'status'.
- sort
if
TRUE, sort the models by the HR values.- decreasing
logical, should the sort order be increasing or decreasing?
- add_all
if
TRUE, add a group for all data rows.- add_caption
if
TRUE, add caption to the plot.- verbose
if
TRUE, print extra info.- headings
a
listfor setting the heading text.- ...
other arguments passing to
forestmodel::forest_model().
Value
a list.
Examples
library(survival)
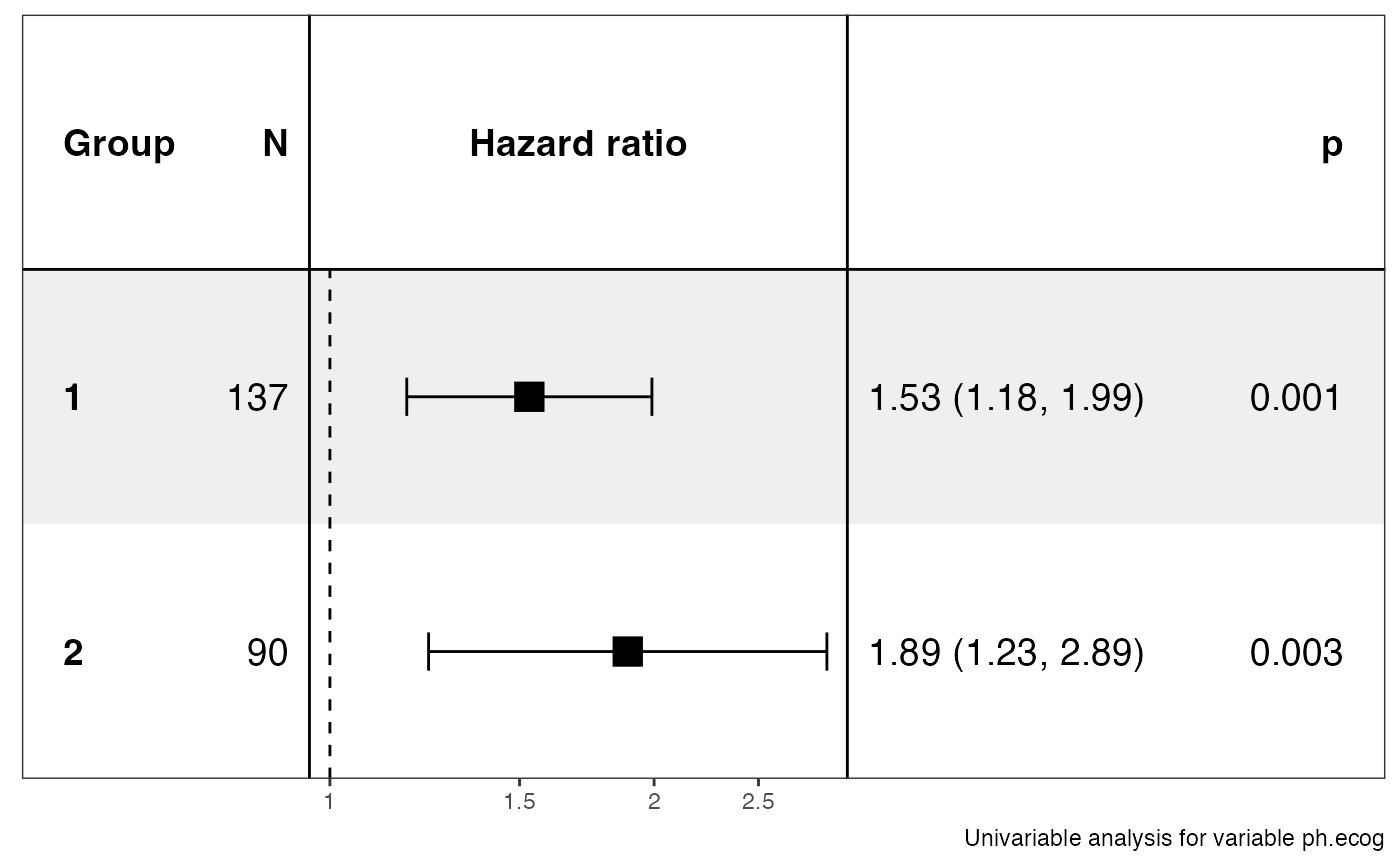
ezcox_group(lung, grp_var = "sex", covariate = "ph.ecog")
#> => Processing variable 1
#> ==> Building Surv object...
#> ==> Building Cox model...
#> ==> Done.
#> => Processing variable 2
#> ==> Building Surv object...
#> ==> Building Cox model...
#> ==> Done.
#> covariates=NULL but drop_controls=TRUE, detecting controls...
#> No. Skipping...
#> Done.
#> Resized limits to included dashed line in forest panel
#> Returns a list containing data and ggplot.
#> $data
#> $stats
#> # A tibble: 2 × 13
#> Group Variable is_control contrast…¹ ref_l…² n_con…³ n_ref beta HR lower…⁴
#> <chr> <chr> <lgl> <chr> <chr> <int> <int> <dbl> <dbl> <dbl>
#> 1 1 ph.ecog FALSE 1 1 137 137 0.426 1.53 1.18
#> 2 2 ph.ecog FALSE 2 2 90 90 0.637 1.89 1.23
#> # … with 3 more variables: upper_95 <dbl>, p.value <dbl>, global.pval <dbl>,
#> # and abbreviated variable names ¹contrast_level, ²ref_level, ³n_contrast,
#> # ⁴lower_95
#>
#> $models
#> # A tibble: 2 × 6
#> Group Variable control model_file model status
#> <chr> <chr> <chr> <chr> <list> <lgl>
#> 1 1 ph.ecog NA /var/folders/bj/nw1w4g1j37ddpgb6zmh3sfh… <coxph> TRUE
#> 2 2 ph.ecog NA /var/folders/bj/nw1w4g1j37ddpgb6zmh3sfh… <coxph> TRUE
#>
#> attr(,"class")
#> [1] "ezcox"
#>
#> $plot
 #>
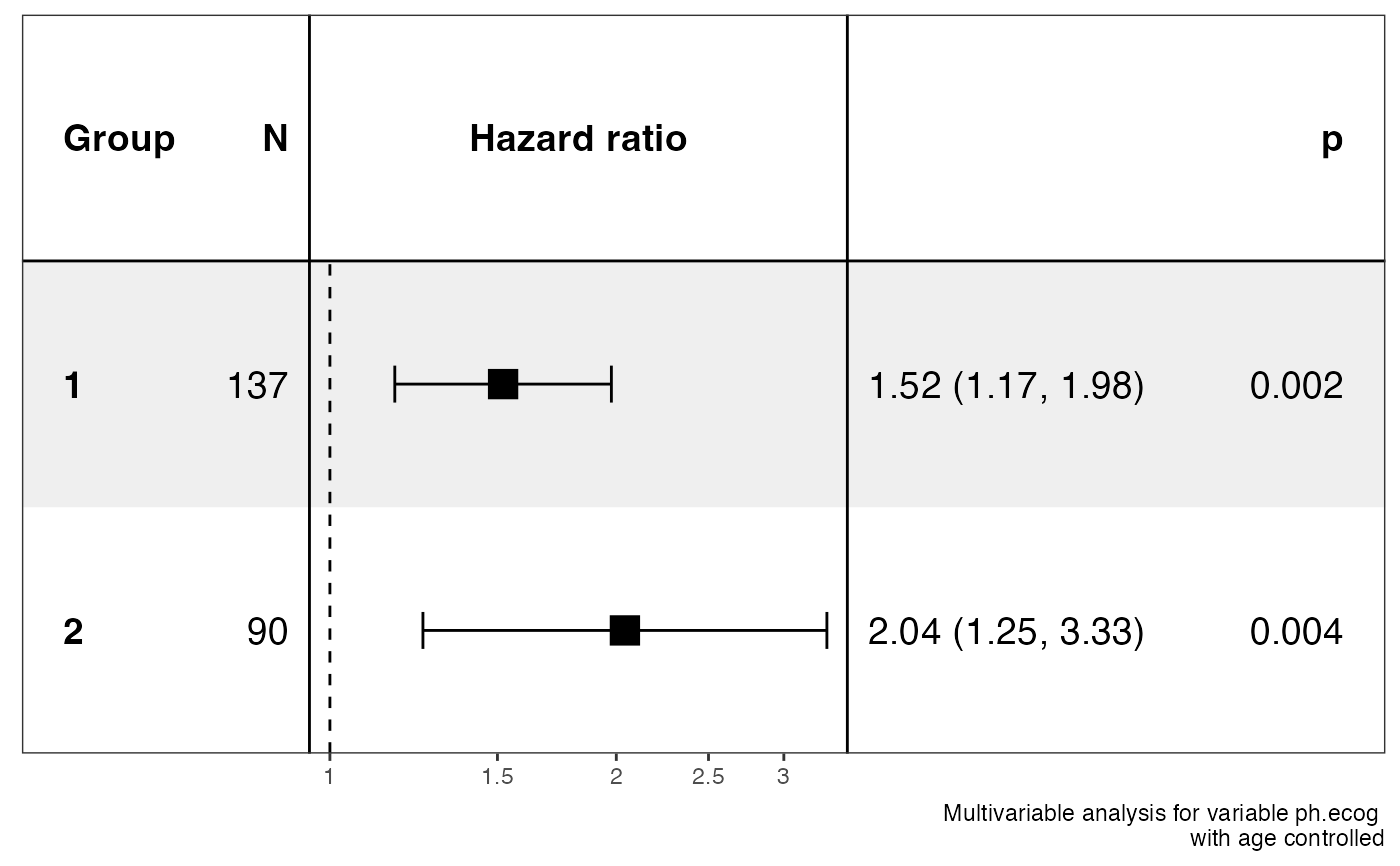
ezcox_group(lung, grp_var = "sex", covariate = "ph.ecog", controls = "age")
#> => Processing variable 1
#> ==> Building Surv object...
#> ==> Building Cox model...
#> ==> Done.
#> => Processing variable 2
#> ==> Building Surv object...
#> ==> Building Cox model...
#> ==> Done.
#> covariates=NULL but drop_controls=TRUE, detecting controls...
#> Yes. Setting variables to keep...
#> Done.
#> Resized limits to included dashed line in forest panel
#> Returns a list containing data and ggplot.
#> $data
#> $stats
#> # A tibble: 4 × 13
#> Group Variable is_control contra…¹ ref_l…² n_con…³ n_ref beta HR lower…⁴
#> <chr> <chr> <lgl> <chr> <chr> <int> <int> <dbl> <dbl> <dbl>
#> 1 1 ph.ecog FALSE 1 1 137 137 0.419 1.52 1.17
#> 2 1 ph.ecog TRUE age age 138 138 0.0184 1.02 0.996
#> 3 2 ph.ecog FALSE 2 2 90 90 0.714 2.04 1.25
#> 4 2 ph.ecog TRUE age age 90 90 -0.0112 0.989 0.957
#> # … with 3 more variables: upper_95 <dbl>, p.value <dbl>, global.pval <dbl>,
#> # and abbreviated variable names ¹contrast_level, ²ref_level, ³n_contrast,
#> # ⁴lower_95
#>
#> $models
#> # A tibble: 2 × 6
#> Group Variable control model_file model status
#> <chr> <chr> <chr> <chr> <list> <lgl>
#> 1 1 ph.ecog age /var/folders/bj/nw1w4g1j37ddpgb6zmh3sfh… <coxph> TRUE
#> 2 2 ph.ecog age /var/folders/bj/nw1w4g1j37ddpgb6zmh3sfh… <coxph> TRUE
#>
#> attr(,"class")
#> [1] "ezcox"
#>
#> $plot
#>
ezcox_group(lung, grp_var = "sex", covariate = "ph.ecog", controls = "age")
#> => Processing variable 1
#> ==> Building Surv object...
#> ==> Building Cox model...
#> ==> Done.
#> => Processing variable 2
#> ==> Building Surv object...
#> ==> Building Cox model...
#> ==> Done.
#> covariates=NULL but drop_controls=TRUE, detecting controls...
#> Yes. Setting variables to keep...
#> Done.
#> Resized limits to included dashed line in forest panel
#> Returns a list containing data and ggplot.
#> $data
#> $stats
#> # A tibble: 4 × 13
#> Group Variable is_control contra…¹ ref_l…² n_con…³ n_ref beta HR lower…⁴
#> <chr> <chr> <lgl> <chr> <chr> <int> <int> <dbl> <dbl> <dbl>
#> 1 1 ph.ecog FALSE 1 1 137 137 0.419 1.52 1.17
#> 2 1 ph.ecog TRUE age age 138 138 0.0184 1.02 0.996
#> 3 2 ph.ecog FALSE 2 2 90 90 0.714 2.04 1.25
#> 4 2 ph.ecog TRUE age age 90 90 -0.0112 0.989 0.957
#> # … with 3 more variables: upper_95 <dbl>, p.value <dbl>, global.pval <dbl>,
#> # and abbreviated variable names ¹contrast_level, ²ref_level, ³n_contrast,
#> # ⁴lower_95
#>
#> $models
#> # A tibble: 2 × 6
#> Group Variable control model_file model status
#> <chr> <chr> <chr> <chr> <list> <lgl>
#> 1 1 ph.ecog age /var/folders/bj/nw1w4g1j37ddpgb6zmh3sfh… <coxph> TRUE
#> 2 2 ph.ecog age /var/folders/bj/nw1w4g1j37ddpgb6zmh3sfh… <coxph> TRUE
#>
#> attr(,"class")
#> [1] "ezcox"
#>
#> $plot
 #>
p <- ezcox_group(lung,
grp_var = "sex", covariate = "ph.ecog",
controls = "age", add_all = TRUE
)
#> => Processing variable 1
#> ==> Building Surv object...
#> ==> Building Cox model...
#> ==> Done.
#> => Processing variable 2
#> ==> Building Surv object...
#> ==> Building Cox model...
#> ==> Done.
#> => Processing variable ALL
#> ==> Building Surv object...
#> ==> Building Cox model...
#> ==> Done.
#> covariates=NULL but drop_controls=TRUE, detecting controls...
#> Yes. Setting variables to keep...
#> Done.
#> Resized limits to included dashed line in forest panel
#> Returns a list containing data and ggplot.
#>
p <- ezcox_group(lung,
grp_var = "sex", covariate = "ph.ecog",
controls = "age", add_all = TRUE
)
#> => Processing variable 1
#> ==> Building Surv object...
#> ==> Building Cox model...
#> ==> Done.
#> => Processing variable 2
#> ==> Building Surv object...
#> ==> Building Cox model...
#> ==> Done.
#> => Processing variable ALL
#> ==> Building Surv object...
#> ==> Building Cox model...
#> ==> Done.
#> covariates=NULL but drop_controls=TRUE, detecting controls...
#> Yes. Setting variables to keep...
#> Done.
#> Resized limits to included dashed line in forest panel
#> Returns a list containing data and ggplot.