metawho
metawho.RmdThe goal of metawho is to provide simple R implementation of “Meta-analytical method to Identify Who Benefits Most from Treatments” (called ‘deft’ approach, see reference #2).
metawho is powered by R package metafor and does not support dataset contains individuals for now. Please use stata package ipdmetan if you are more familar with stata code.
Example
This is a basic example which shows you how to solve a common problem.
Prepare data
If you have HR and confidence intervals, please run deft_prepare() firstly.
library(metawho)

### specify hazard ratios (hr)
hr    <- c(0.30, 0.11, 1.25, 0.63, 0.90, 0.28)
### specify lower bound for hr confidence intervals
ci.lb <- c(0.09, 0.02, 0.82, 0.42, 0.41, 0.12)
### specify upper bound for hr confidence intervals
ci.ub <- c(1.00, 0.56, 1.90, 0.95, 1.99, 0.67)
### specify sample number
ni <- c(16L, 18L, 118L, 122L, 37L, 38L)
### trials
trial <- c("Rizvi 2015", "Rizvi 2015",
          "Rizvi 2018", "Rizvi 2018",
          "Hellmann 2018", "Hellmann 2018")
### subgroups
subgroup = rep(c("Male", "Female"), 3)

entry <- paste(trial, subgroup, sep = "-")
### combine as data.frame

wang2019 =
   data.frame(
        entry = entry,
        trial = trial,
        subgroup = subgroup,
        hr = hr,
        ci.lb = ci.lb,
        ci.ub = ci.ub,
        ni = ni,
        stringsAsFactors = FALSE
       )

wang2019 = deft_prepare(wang2019)
Here we can directly load example data.
library(metawho)
data("wang2019")

wang2019
#>                  entry         trial subgroup   hr ci.lb ci.ub  ni
#> 1      Rizvi 2015-Male    Rizvi 2015     Male 0.30  0.09  1.00  16
#> 2    Rizvi 2015-Female    Rizvi 2015   Female 0.11  0.02  0.56  18
#> 3      Rizvi 2018-Male    Rizvi 2018     Male 1.25  0.82  1.90 118
#> 4    Rizvi 2018-Female    Rizvi 2018   Female 0.63  0.42  0.95 122
#> 5   Hellmann 2018-Male Hellmann 2018     Male 0.90  0.41  1.99  37
#> 6 Hellmann 2018-Female Hellmann 2018   Female 0.28  0.12  0.67  38
#>     conf_q         yi       sei
#> 1 1.959964 -1.2039728 0.6142831
#> 2 1.959964 -2.2072749 0.8500678
#> 3 1.959964  0.2231436 0.2143674
#> 4 1.959964 -0.4620355 0.2082200
#> 5 1.959964 -0.1053605 0.4030005
#> 6 1.959964 -1.2729657 0.4387290
Do deft analysis
Use deft_do() function to obtain model results.
# The 'Male' is the reference
(res = deft_do(wang2019, group_level = c("Male", "Female")))
#> $all
#> $all$data
#>                  entry         trial subgroup   hr ci.lb ci.ub  ni
#> 1      Rizvi 2015-Male    Rizvi 2015     Male 0.30  0.09  1.00  16
#> 2    Rizvi 2015-Female    Rizvi 2015   Female 0.11  0.02  0.56  18
#> 3      Rizvi 2018-Male    Rizvi 2018     Male 1.25  0.82  1.90 118
#> 4    Rizvi 2018-Female    Rizvi 2018   Female 0.63  0.42  0.95 122
#> 5   Hellmann 2018-Male Hellmann 2018     Male 0.90  0.41  1.99  37
#> 6 Hellmann 2018-Female Hellmann 2018   Female 0.28  0.12  0.67  38
#>     conf_q         yi       sei
#> 1 1.959964 -1.2039728 0.6142831
#> 2 1.959964 -2.2072749 0.8500678
#> 3 1.959964  0.2231436 0.2143674
#> 4 1.959964 -0.4620355 0.2082200
#> 5 1.959964 -0.1053605 0.4030005
#> 6 1.959964 -1.2729657 0.4387290
#>
#> $all$model
#>
#> Fixed-Effects Model (k = 6)
#>
#> Test for Heterogeneity:
#> Q(df = 5) = 18.8865, p-val = 0.0020
#>
#> Model Results:
#>
#> estimate      se     zval    pval    ci.lb    ci.ub
#>  -0.3207  0.1289  -2.4883  0.0128  -0.5733  -0.0681  *
#>
#> ---
#> Signif. codes:  0 '***' 0.001 '**' 0.01 '*' 0.05 '.' 0.1 ' ' 1
#>
#>
#>
#> $subgroup
#> $subgroup$data
#>           trial        hr     ci.lb     ci.ub  ni   conf_q        yi
#> 1    Rizvi 2015 0.3666667 0.0469397 2.8641945  34 1.959964 -1.003302
#> 2    Rizvi 2018 0.5040000 0.2805772 0.9053338 240 1.959964 -0.685179
#> 3 Hellmann 2018 0.3111111 0.0967900 1.0000013  75 1.959964 -1.167605
#>         sei
#> 1 1.0487893
#> 2 0.2988460
#> 3 0.5957285
#>
#> $subgroup$model
#>
#> Fixed-Effects Model (k = 3)
#>
#> Test for Heterogeneity:
#> Q(df = 2) = 0.5657, p-val = 0.7536
#>
#> Model Results:
#>
#> estimate      se     zval    pval    ci.lb    ci.ub
#>  -0.7956  0.2589  -3.0737  0.0021  -1.3030  -0.2883  **
#>
#> ---
#> Signif. codes:  0 '***' 0.001 '**' 0.01 '*' 0.05 '.' 0.1 ' ' 1
#>
#>
#>
#> attr(,"class")
#> [1] "deft"
Show analysis result
Use deft_show() to visualize results.
To show all entries without model result.
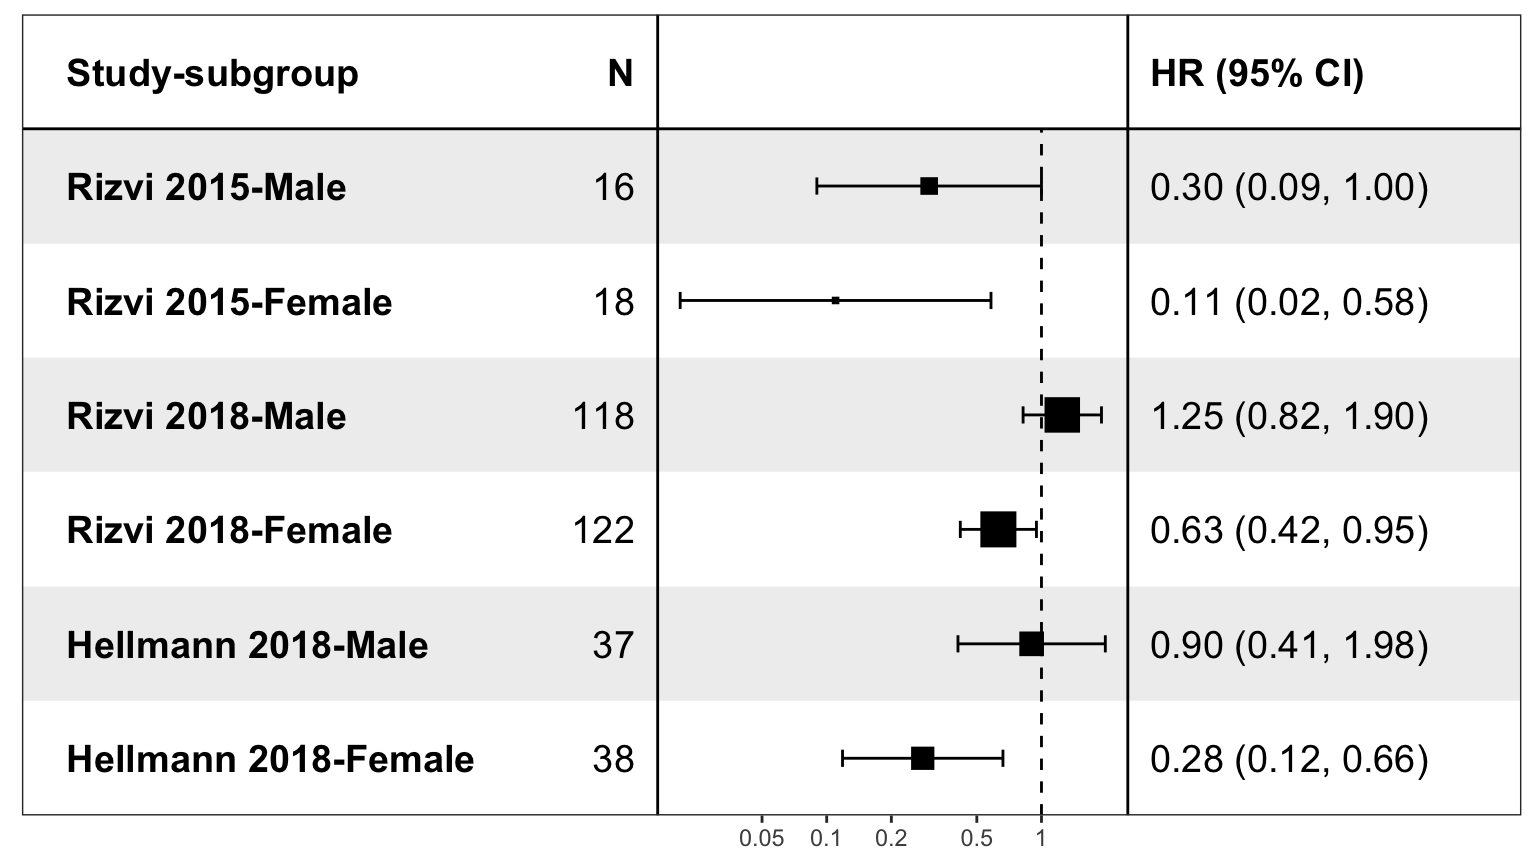
To show result of subgroup analysis.
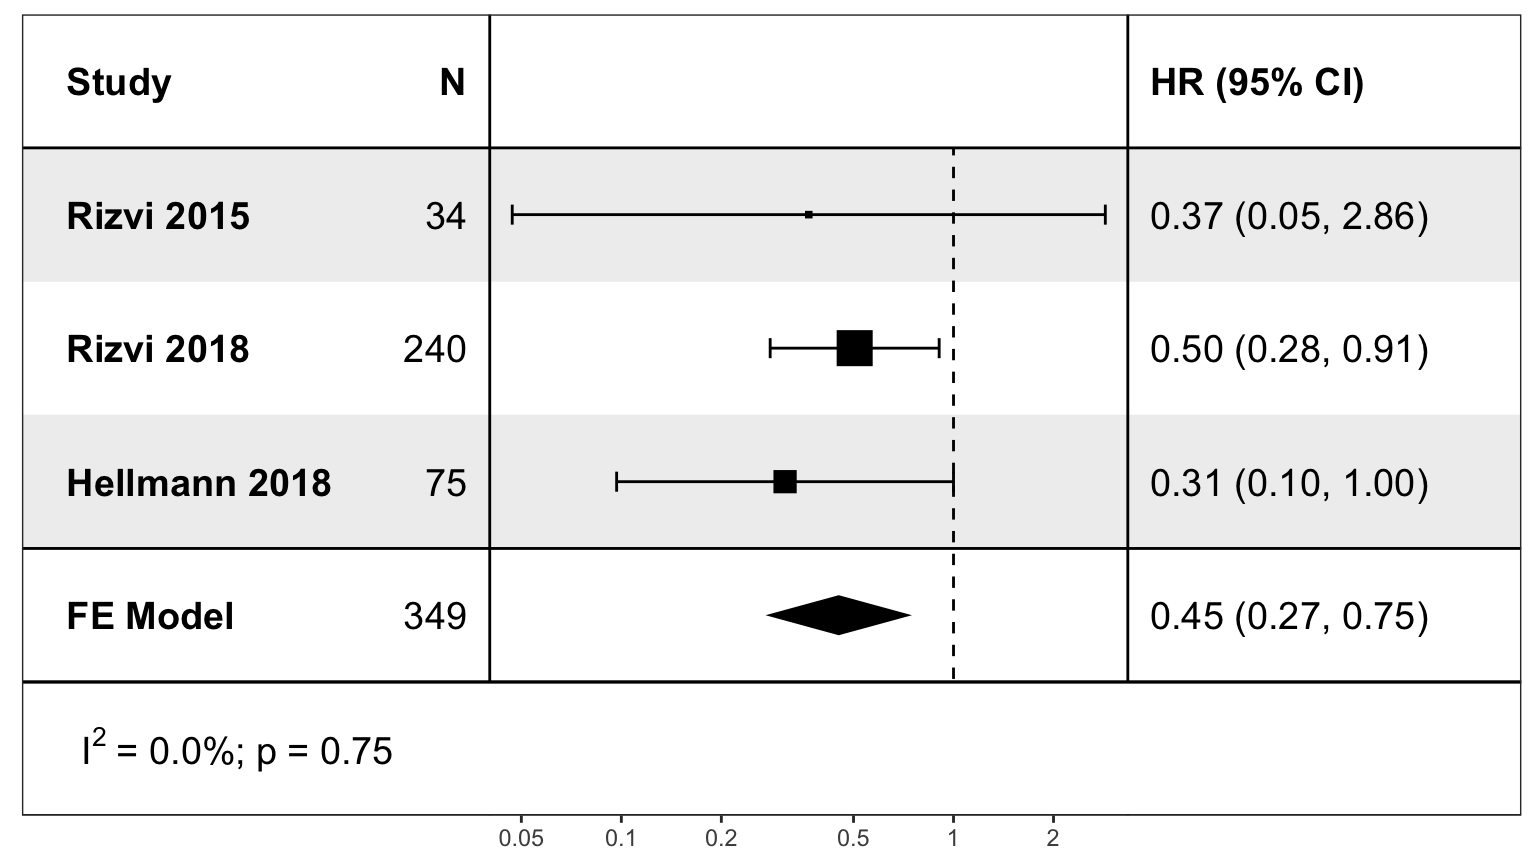
The analysis above reproduced Figure 5 of reference #1.
Combine with metafor
The result of deft_do() contains models constructed by metafor package, so you can use features provided by metafor package, e.g. plot the model results with forest() function from metafor package.
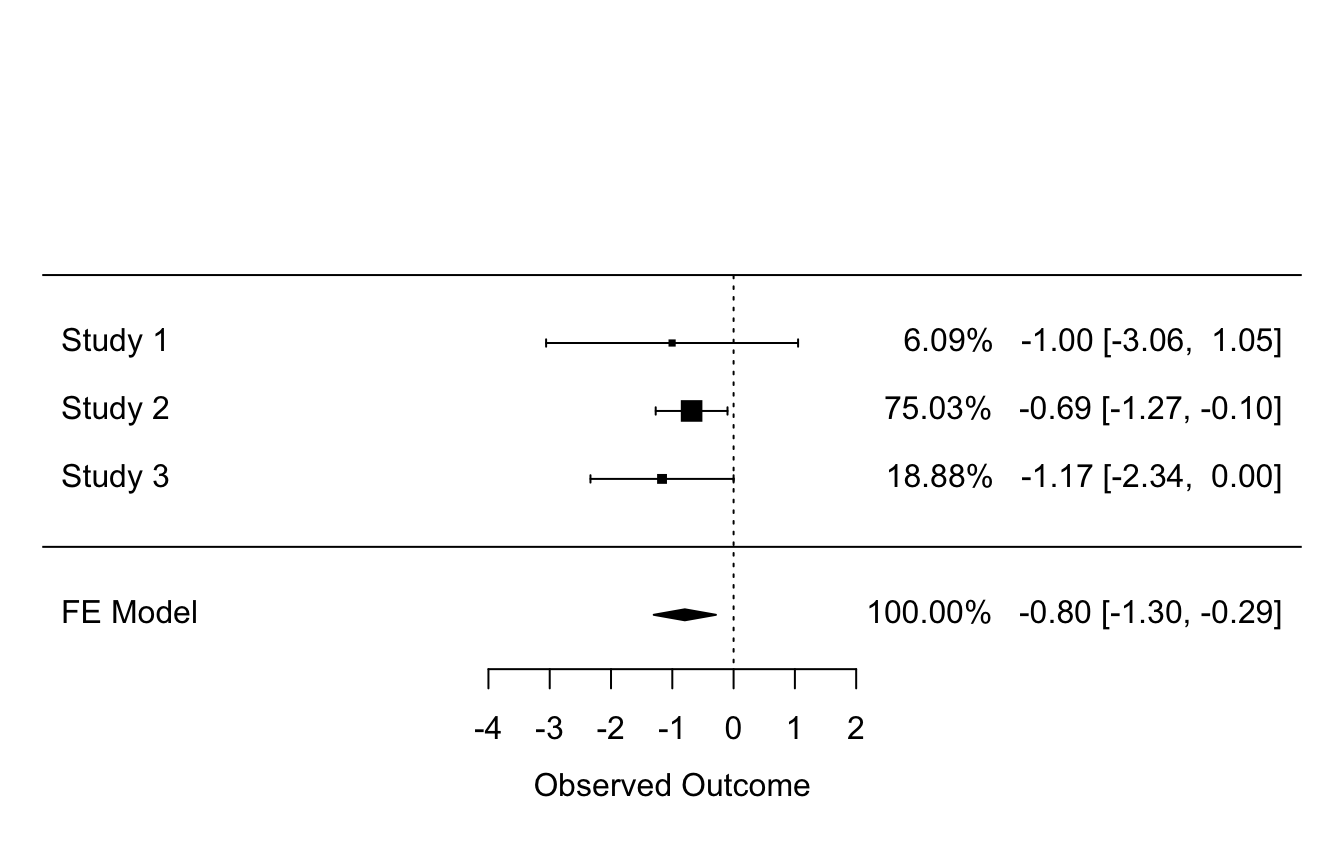
Modify plot, more see ?forest.rma.
forest(res$subgroup$model, showweights = TRUE, atransf = exp,
       slab = res$subgroup$data$trial,
       xlab = "Hazard ratio")
op = par(no.readonly = TRUE)
par(cex = 0.75, font = 2)
text(-11, 4.5, "Trial(s)", pos = 4)
text(9, 4.5, "Hazard Ratio [95% CI]", pos = 2)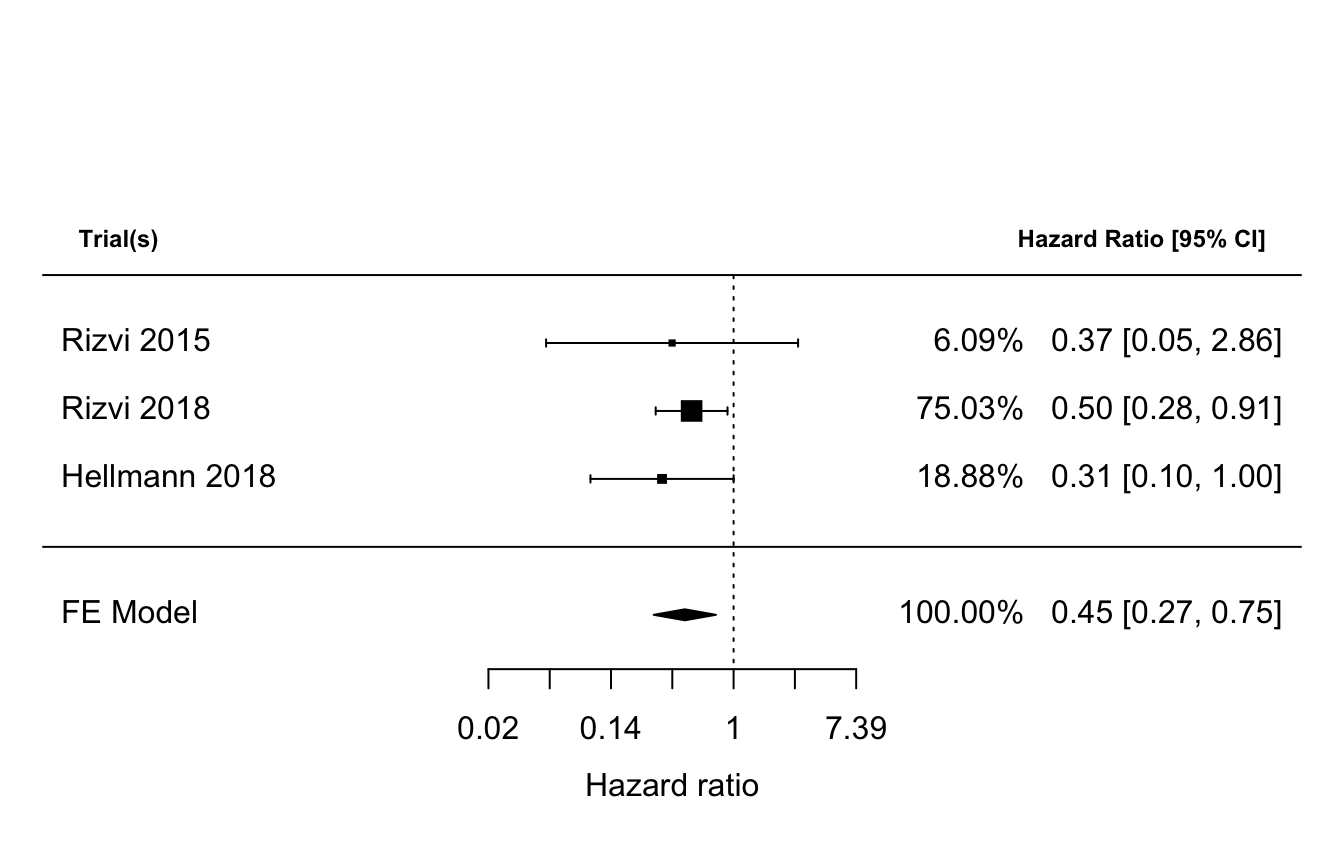
More usage about model fit, prediction and plotting please refer to metafor package.
References
- Wang, Shixiang, et al. “The predictive power of tumor mutational burden in lung cancer immunotherapy response is influenced by patients’ sex.” International journal of cancer (2019).
- Fisher, David J., et al. “Meta-analytical methods to identify who benefits most from treatments: daft, deluded, or deft approach?.” bmj 356 (2017): j573.